Figure 4.

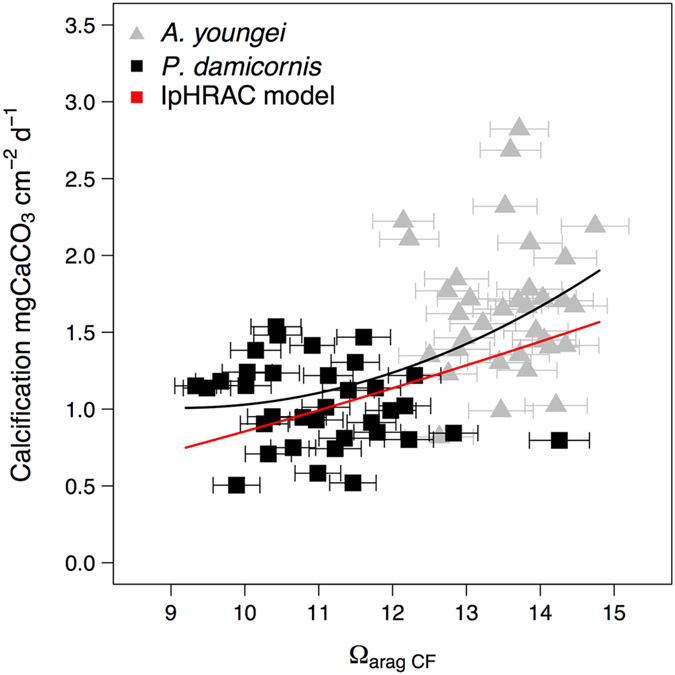
Calcification rates of Acropora youngei (grey triangles) and Pocillopora damicornis (black dots) as a function of estimates of the aragonite saturation state in the calcifying fluid (Ωarag cf) made using estimates of pHcf and DICcf. The horizontal error-bars represent the uncertainties on Ωarag cf estimates. The mean relationship between calcification and ΩaragCF for both species was best fitted by the polynomial relationship y = 0.025X 2 + 0.63x + 3.03 (black line). The red lines corresponded to a “bio-inorganic model” of calcification based on the known abiotic rate kinetics of CaCO3 precipitation as a function the aragonite saturation state Ωcf (IpHRAC)9. This model is based on an empirical exponential rate dependence law for carbonate precipitation (G): G = k a (Ω cf − 1)n; with k a = −0.0177T2 + 1.47 T + 14.9 and n = 0.0628 T + 0.0985.
