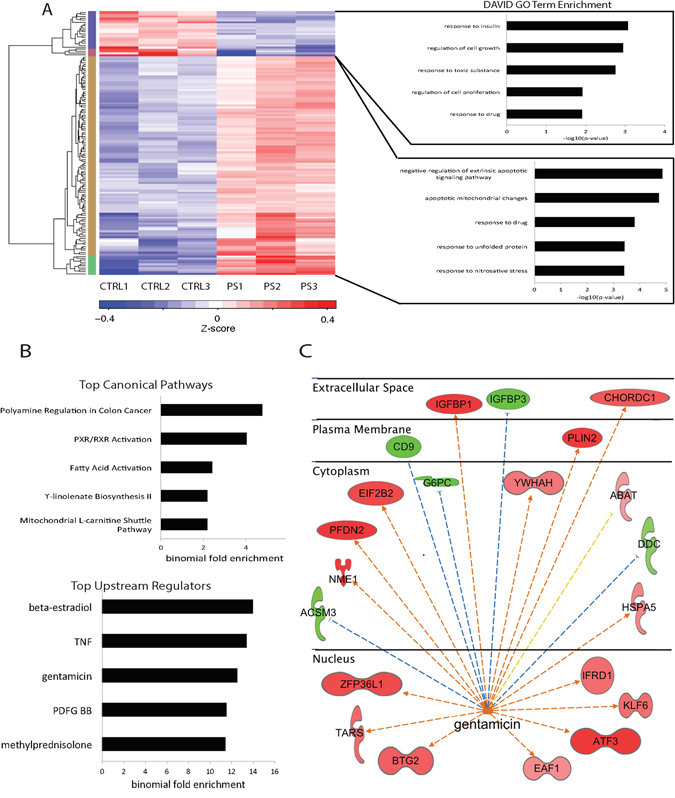
Figure 2.

RNA-seq analysis on HepG2 cells cultured with and without PenStrep. (A) Shown in the top left is a heatmap depicting relative expression levels for all 209 differentially expressed genes across all three replicates per treatment. To the right of each cluster, the top gene ontology terms as determined by DAVID v6.824 are shown. (B) PenStrep DE genes canonical pathways and upstream regulators with the top five highest binomial fold enrichment values and most significant p-values as determined by IPA. (C) IPA network analysis for gentamicin, one of the top most significant upstream regulators for PenStrep DE genes. This network is drawn based on calculated z-scores for published gene expression patterns under gentamicin as determined by IPA.
