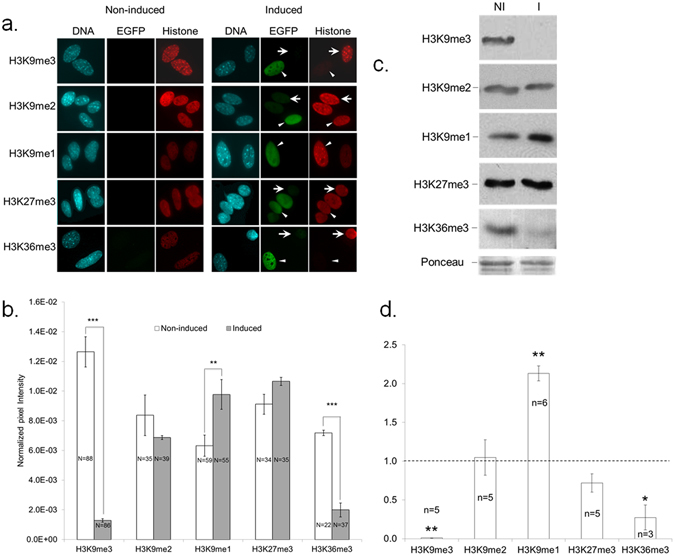
Figure 2.

Characterization of histone methylation in Kdm4b-EGFP expressing MEFs. (a) Immunofluorescence of histone modifications in non-induced (NI) vs induced (I) MEFs. Cells were co-stained for EGFP and histone modification antibodies. Arrowheads and arrows indicate EGFP-positive and –negative nuclei, respectively. (b) Quantification of global histone methylation in NI vs I MEFs. Values represent normalized pixel intensity ± SEM. Asterisks indicate significant differences. N = number of nuclei quantified, RU = relative units; ***P < 0.001; **P < 0.01. (c,d) Kdm4b-dependent changes in levels of H3K9 methylation states. (c) Histone extracts from NI vs I MEFs were quantified for the indicated histone modifications by western blot. Shown are cropped representative blots for the different methyl states of H3 and a cropped representative Ponceau staining. (d) Quantification of western analysis. Results represent H3 methylation levels in induced cells as a percentage of non-induced levels ± SEM. Dotted line indicates NI level; n = number of replicate experiments, Bars with an asterisk differ from NI level at **P < 0.005, *P < 0.05, as determined by two–tailed paired t-test on normalised band intensities.
