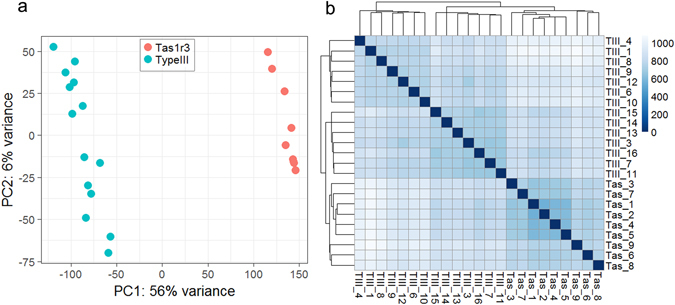
Figure 1.

Comparisons of global gene expression among individual Tas1r3+ cells and type III cells. (a) Principal component analysis of Tas1r3+ cells (red) and type III cells (blue). (b) Hierarchical cluster analysis and heat map of Euclidean distances (shown in Table S4) among individual Tas1r3+ (Tas_1 through Tas_9) cells and type III cells (TIII_1 through TIII_16). Darker shades of blue indicate smaller sample distance and higher relatedness between libraries (scale bar, right). Both analyses show that transcriptomes from cognate cells are more similar to each other than to transcriptomes from cells belonging to the different group.
