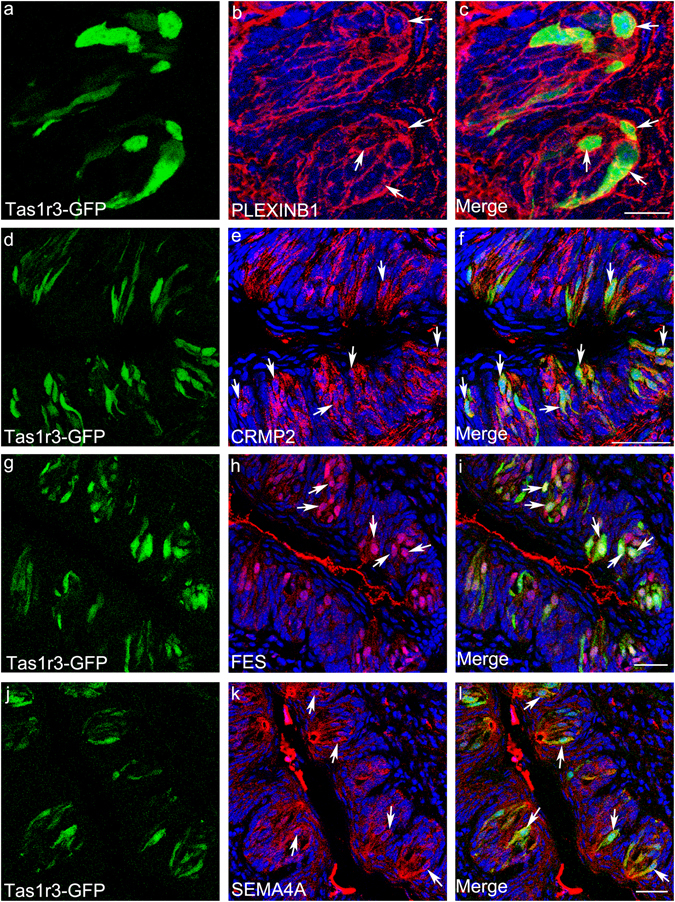
Figure 6.

Expression of semaphorin pathway genes in Tas1r3+ taste cells. Immunostaining identifies the semaphorin pathway components PLEXINB1, CRMP2, FES and SEMA4A (red, a,d,g,j). Intrinsic fluorescence of Tas1r3-GFP identifies Tas1r3+ taste cells (green, b,e,h,k). Merged images (c,f,i,l) indicate that most Tas1r3+ cells express the semaphorin pathway components examined, and that they are expressed in other taste cells also. Arrows point to cells co-expressing Tas1r3-GFP and PLEXINB1, CRMP2, FES or SEMA4A. Scale bars: c = 16 µm, f, i, l = 40 µm.
