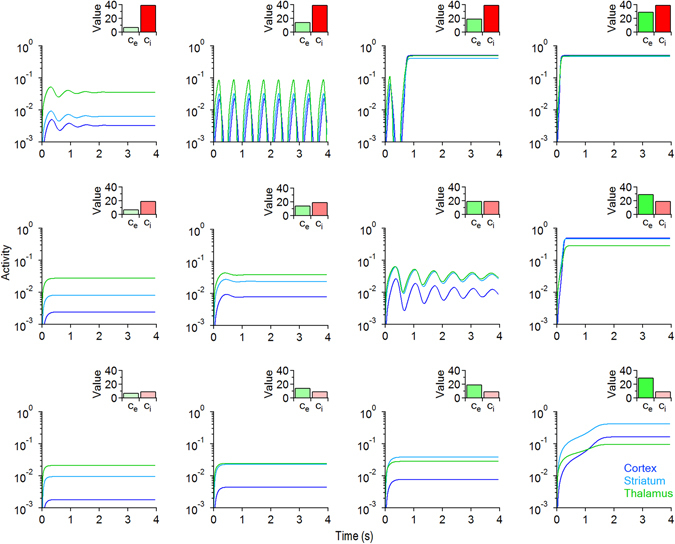
Figure 2.

Evolution of the temporal behavior of the CSTC pathway in response to changes in global excitation (c e) and inhibition (c i). Each curve represents the temporal evolution in the activity of the cortex (blue), striatum (cyan) and thalamus (green). The insets show the values of c e and c i used in each set of simulations (c e = 8, 15, 20, 30 and c i = 10, 20, 40). Excitation increases from left to right in each row. Inhibition increases from bottom to top in each column. Other parameters are fixed as follows: τ e = 4, b e = 1.2, τ i = 2, b i = 1, P = 1.
