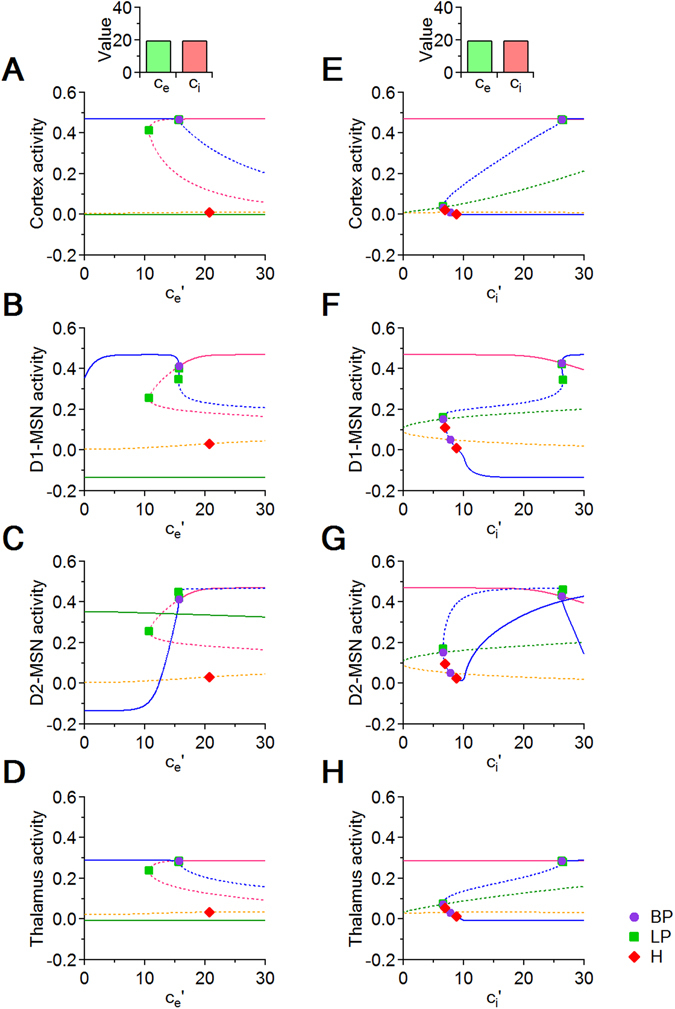
Figure 4.

Bifurcation diagrams with respect to and . (A–D) In each panel, we test how changing the strength of local excitation onto D1- and D2-MSNs (i.e. ) affects the activity of the cortex, of the two populations of MSNs and the thalamus. The strength of excitation and inhibition in the rest of the system is set to c e = c i = 20 (top inset). (E–H) In each panel, we analyze how changing the strength of inhibition onto D1- and D2-MSNs (i.e. ) affects the activity of the cortex, MSNs and the thalamus. The strength of excitation and inhibition in the rest of the system is set to c e = c i = 20.
