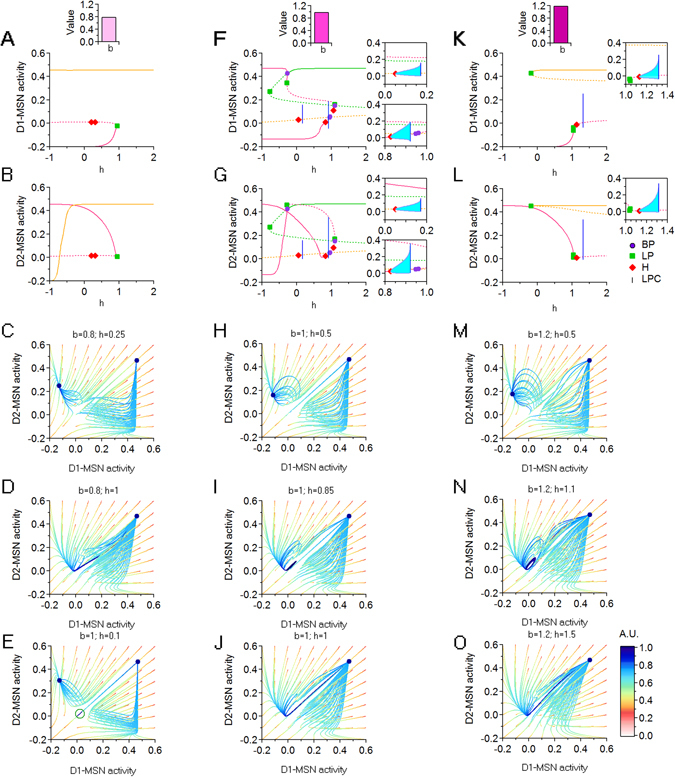
Figure 9.

Dynamic transitions for b = 0.8, b = 1 and b = 1.2. (A,B) Bifurcation diagrams with respect to h, for D1- and D2-MSNs, when b = 0.8. (C,D) Trajectories in a (D1, D2) phase space slice for b = 0.8 and h = 0.25 and h = 1. (E) As in (C,D), for b = 1 and h = 0.1. (F,G) As in (A,B), for b = 1. (H–J) As in (C,D), for b = 1 and for different values of h. (K,L) As in (A,B) for b = 1.2. (M–O) As in (C,D), for b = 1.2 and for different values of h. Fixed parameters: .
