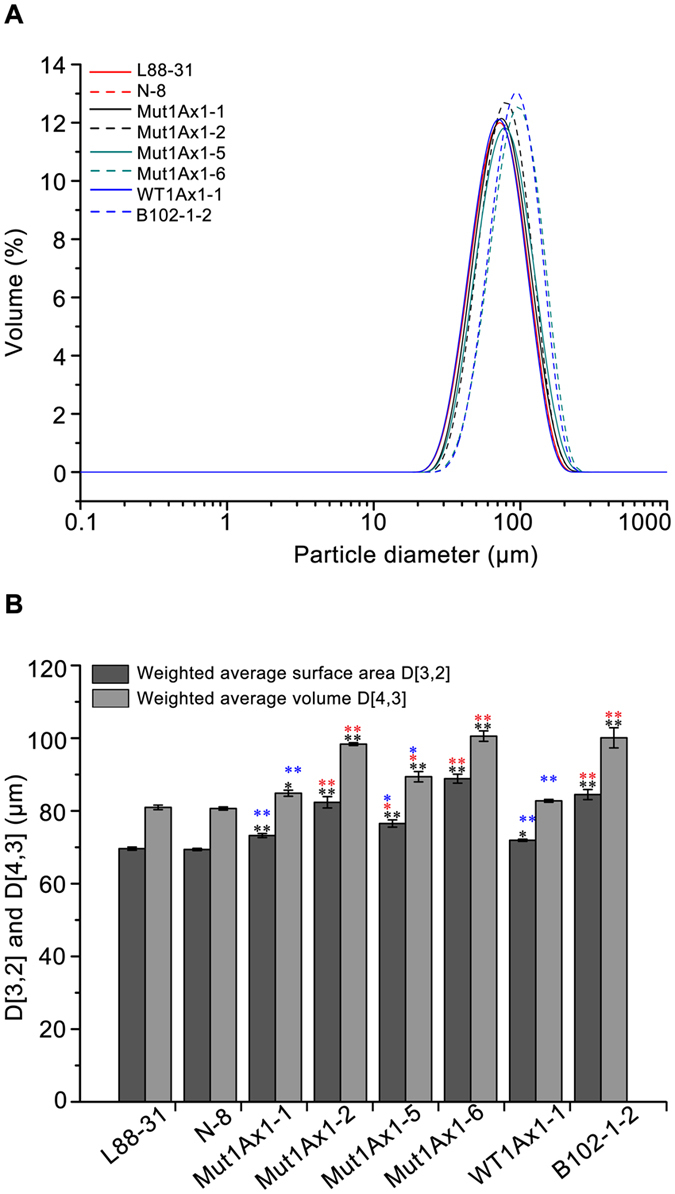
Figure 5.

Effects of Mut1Ax1 on GMP particles size distribution. (A) The size distribution patterns of GMP particles extracted from defatted flour samples. (B) Weighted average diameters D[3,2] and D[4,3] of GMP particles. Bars represent the mean ± SEM (n = 4). */** Show the comparisons between all transgenic lines and negative controls (L88-31 and N-8) on the two parameters above, while  and
and  represent comparisons between transgenic lines expressing mut1Ax1 and line WT1Ax1-1 and comparisons between those lines and line B102-1-2, respectively (*P
< 0.05, **P
< 0.01 by Student’s t-test).
