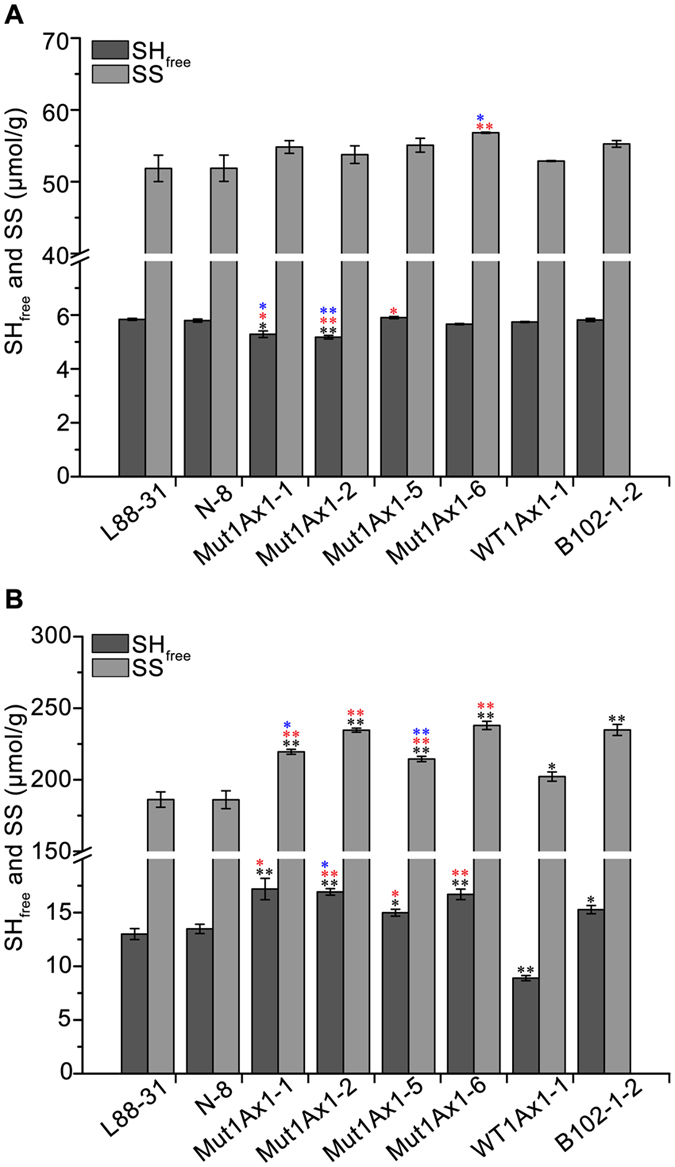
Figure 6.

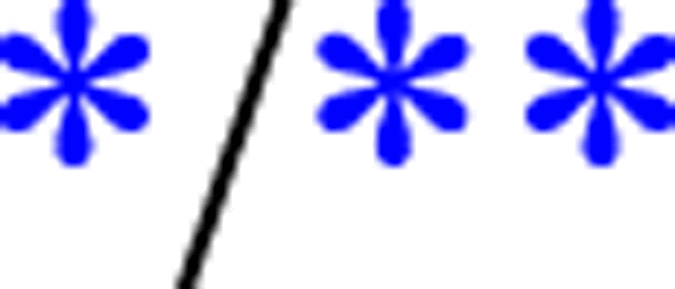
Comparisons of free thiol and disulfide groups in flours and glutens from transgenic and control wheat lines. (A) Relative contents of free thiol and disulfide groups in flour samples from all lines. (B) Relative contents of free thiol and disulfide groups in ground freeze-dried samples from all lines. Bars represent the mean ± SEM. At least three biological experiments were performed. */** Show the comparisons between all transgenic lines and negative controls (L88-31 and N-8) on the contents of free thiol and disulfide groups, while  and
and  represent comparisons between transgenic lines expressing mut1Ax1 and line WT1Ax1-1 and comparisons between those lines and line B102-1-2, respectively (*P
< 0.05, **P
< 0.01 by Student’s t-test).
