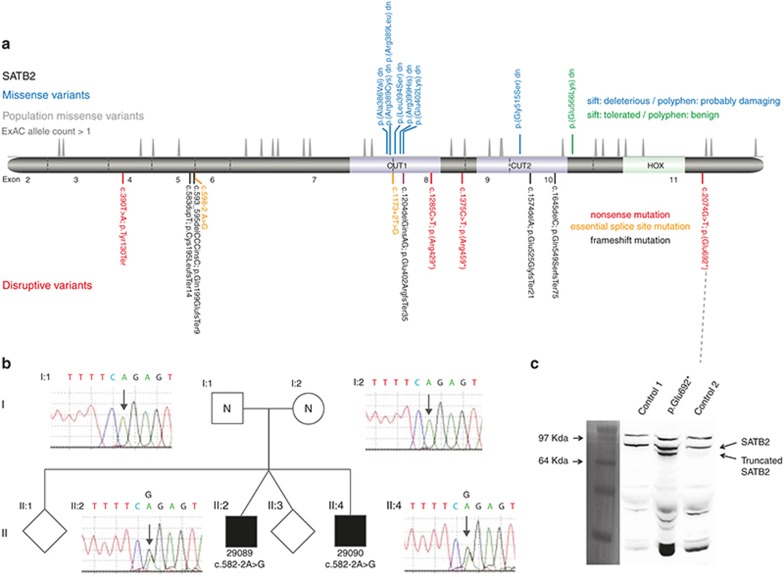
Figure 1.
SATB2 mutation spectrum and consequence. (a) The relative positions of the de novo mutation identified in this article are indicated in a cartoon representation of the SATB2 wild-type protein, which includes the location of the DNA-binding domains. Below the protein diagram are the mutations that are predicted to result in disruption of the open reading frame. The mutations are color-coded by type: nonsense (red), frameshift (purple), and essential splice site (orange). The intron–exon boundaries of the gene encoding the protein are shown as vertical gray lines and the exon number given between these. Above are the missense variants, which have been color-coded to represent the predicted effect of the residue substitution. Immediately above the protein cartoon is a density plot representing the position of all missense variants seen more than once in the Exome Aggregation Consortium database. (b) The family structure and cognate chromatographs are shown of the family with apparent gonadal mosaicism. The affected boys (II:2 29089 and II:4 29090) share the same essential splice site mutation, which is absent in both parents (I:1 and I:2). (c) Photograph of a western blot of protein derived from cultured fibroblasts of two unrelated control individuals and case 14 with a nonsense mutation in the final exon using an antibody made for the C-terminal region of SATB2. A pre-stained protein ladder (Invitrogen LC5925) was used to assess the size of the bands. The same membrane was imaged using both white light and chemiluminescence and the cropped ladder image was size matched and aligned to the immunoblot. The expected SATB2 band of ~80 kDa is seen in all three, with a band of unknown identity above this. A lower band, consistent with the production of the 692-amino-acid C-terminally truncated version on SATB2, is seen in case 14 but not in the control.

