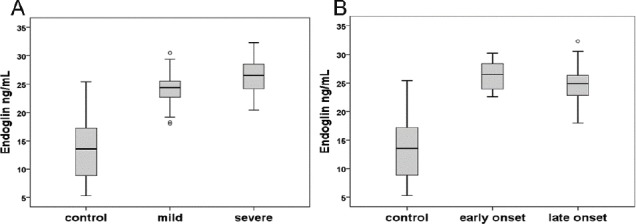
Fig. 2.

Levels of soluble Endoglin (sEng) in preeclampsia (PE) patients and controls. Comparison of sEng level between mild and sever PE patients with controls (A); early- and late-onset PE patients with controls (B) shows a significant increase in all PE groups in comparison with normal women. The 10th and 90th centiles are represented by lower and upper bars, and horizontal lines in the box show median. The circles represent outliers.
