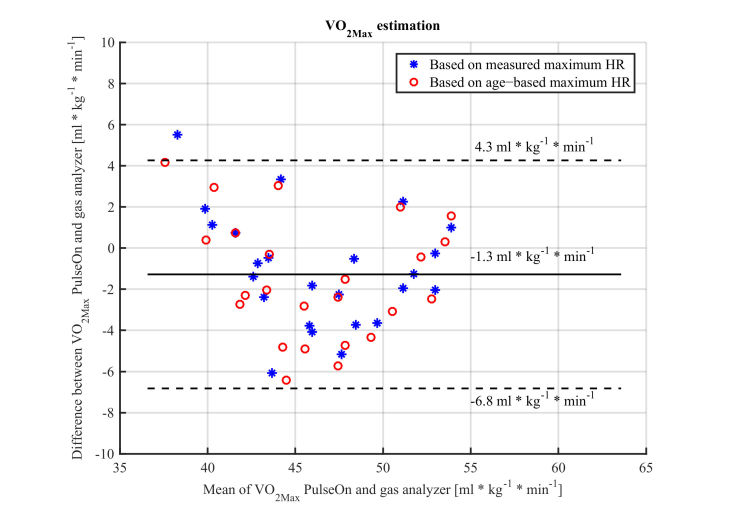
Figure 4.
Bland−Altman plot of VO2Max estimates from the PulseOn app (wrist PPG device + phone GPS) during a submaximal exercise test versus gas analyzer based estimate during maximal exercise tests−dots represent data when age−based maximum HR is used for an estimation, while an asterix represents estimations based on true measured maximum HR (solid horizontal line: bias, dashed lines: 95% confidence limits of agreement).

