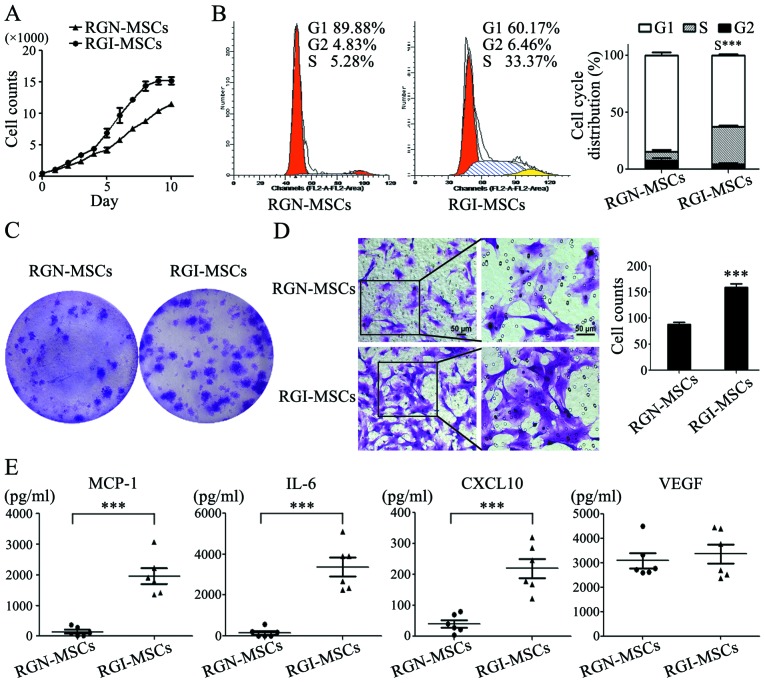
Figure 4.
Comparison of the biological properties of RGI-MSCs and RGN-MSCs. (A) Growth curves of RGN-MSCs and RGI-MSCs. (B) Cell cycle distribution of RGN-MSCs and RGI-MSCs was determined using flow cytometry; ***P<0.001. (C) Cell colony formation assays for RGN-MSCs and RGI-MSCs. (D) Transwell migration assays for RGN-MSCs and RGI-MSCs. Original magnification of the left panel, ×100; the right panel, ×200; scale bar, 50 µm; ***P<0.001. (E) The production of pro-inflammatory factors in RGN-MSCs and RGI-MSCs was determined using Luminex assay; ***P<0.001.

