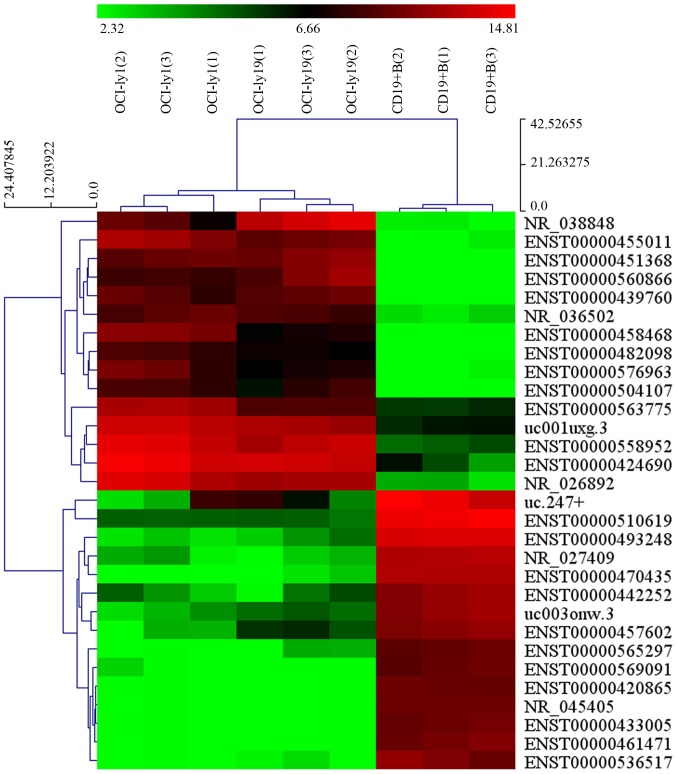
Figure 1.
Hierarchical clustering for differentially expressed lncRNAs. Each row represents a lncRNA and each column represents a sample. The top is the sample clustering tree. The color scale shown at the top illustrates the relative expression level of a lncRNA in an individual slide: red, high expression; green, low expression.

