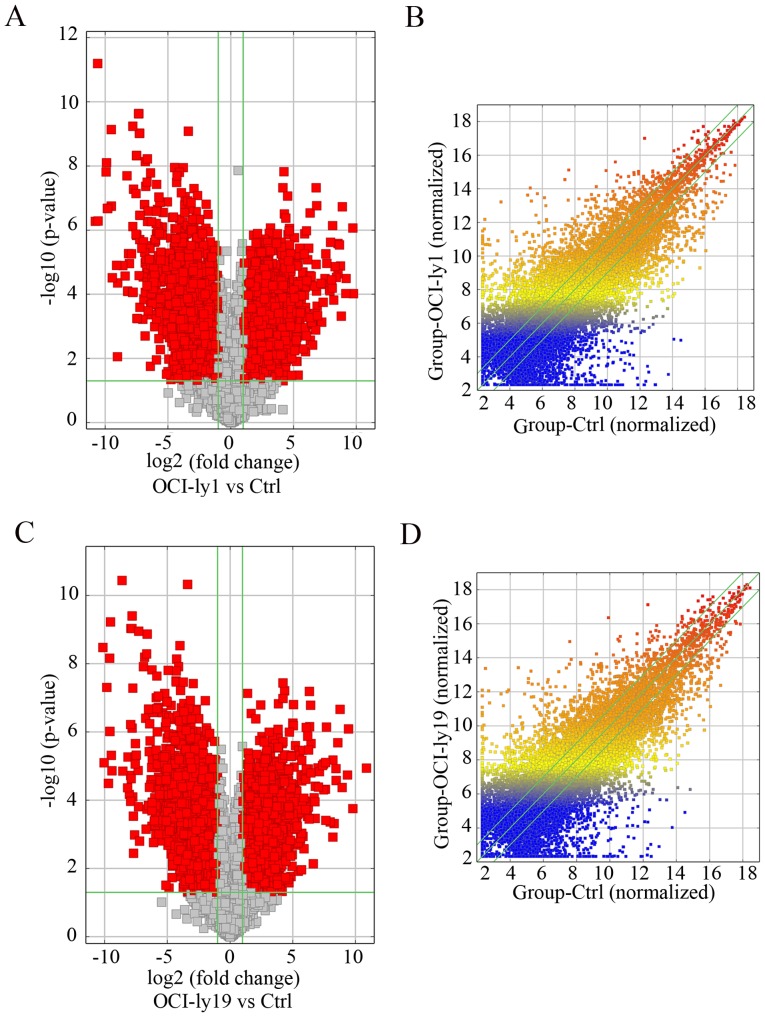
Figure 2.
Volcano plots of differentially expressed lncRNAs in the (A) OCI-ly1 and (C) OCI-ly19 cell lines. Scatter plots of differentially expressed lncRNAs in (B) OCI-ly1 and (D) OCI-ly19 cells. For the volcano plot, the vertical green lines correspond to a 2.0-fold upregulation and downregulation while the horizontal green line represents a P-value of 0.05. The red dots to the left and to the right of the vertical green lines indicate >2.0 fold-change and represent the differentially expressed lncRNAs with statistical significance (fold-change ≥2.0; P<0.05). The values of the x- and y-axes in the scatter plot are the means of normalized signal values of groups of samples (log2 scaled).

