FIG 3 .

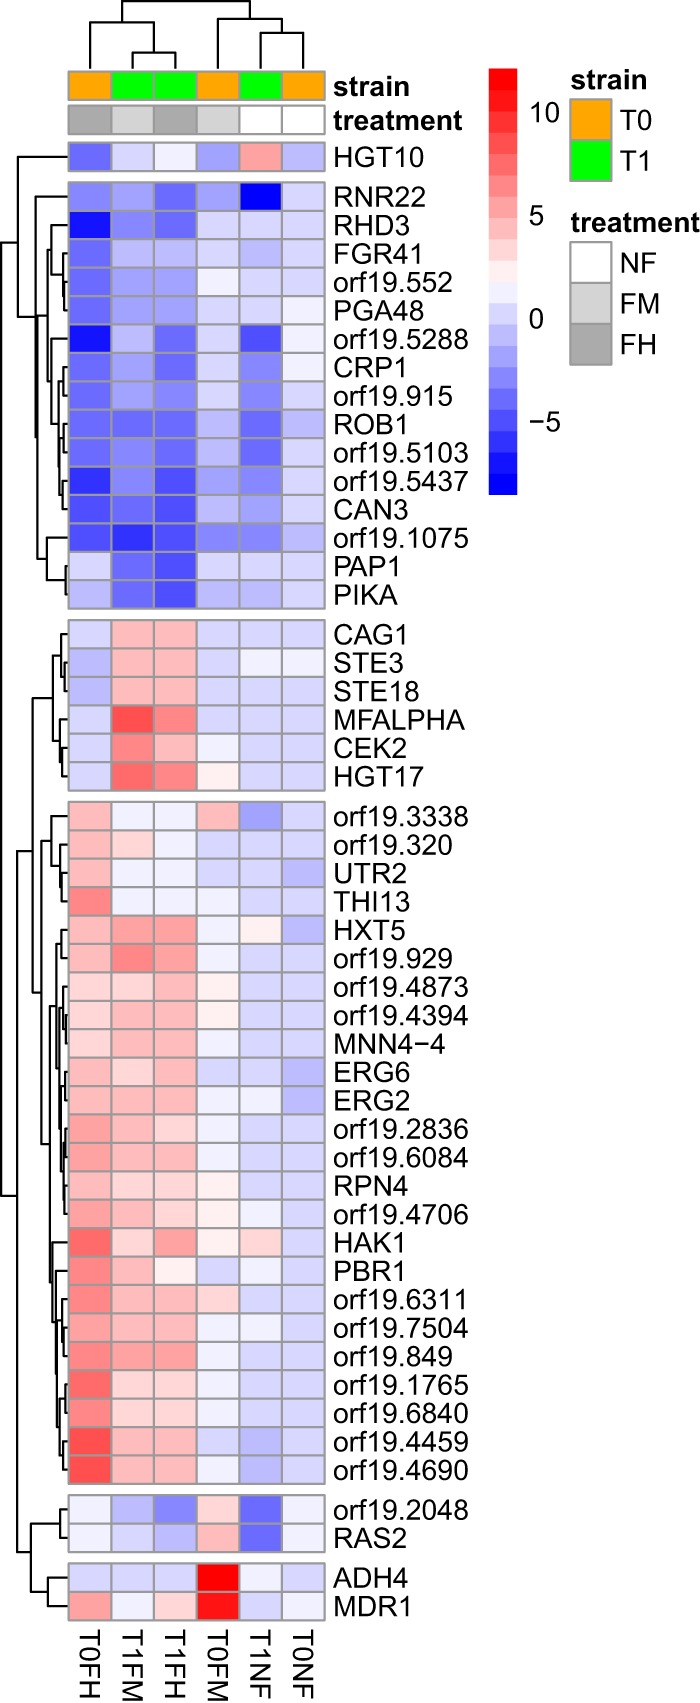
Gene expression heatmap. Depicted are DEGs with a 4-log-fold change for at least one comparison and a false discovery rate-adjusted P value of <1e−18.

Gene expression heatmap. Depicted are DEGs with a 4-log-fold change for at least one comparison and a false discovery rate-adjusted P value of <1e−18.