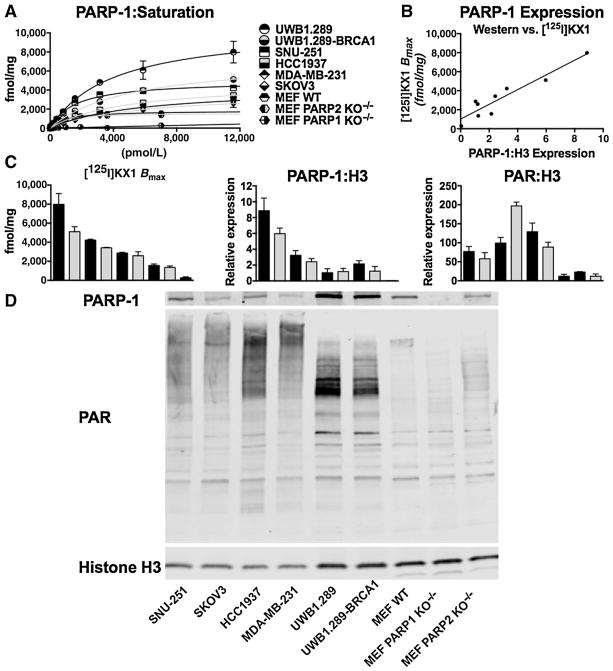
Figure 2.
A, saturation curves for [125I]KX1 in all cell lines evaluated are represented. B, [125I]KX1 Bmax (fmol/mg) values correlated with PARP-1 expression (r2 = 0.88), validating [125I]KX1 as a biomarker for PARP-1 expression. C, the comparison of PARP-1 expression versus activity as defined by [125I]KX1, PARP-1:H3, or PAR:H3, highlighting that [125I]KX1 binding corresponds with PARP-1 expression but not PAR expression. Cell lines listed in A from top to bottom represent bars in bar graphs in C from left to right. D, a representative Western blot analysis of PARP-1, PAR, and Histone H3 is shown.

