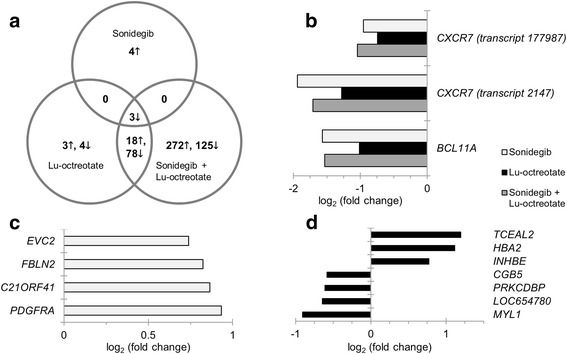
Fig. 2.

Distribution of differentially expressed genes in GOT1 tumors after sonidegib, 177Lu-octreotate and combination treatment. Differentially expressed transcripts in tumors treated with sonidegib, 177Lu-octreotate, or a combination of both pharmaceutical agents (treated vs. control). a: Venn diagram showing the distribution of up- (↓) and downregulated (↑) transcripts. Four, seven and 397 transcripts were uniquely regulated after sonidegib, 177Lu-octreotate and combination treatment, respectively; 96 transcripts were regulated after both 177Lu-octreotate and combination treatment; three transcripts were regulated in all treatment groups. b, c and d: Regulation patterns for the three commonly regulated transcripts and the four and seven transcripts uniquely regulated after sonidegib and 177Lu-octreotate treatment, respectively, with corresponding Illumina probe IDs. Transcripts with adjusted p-value < 0.01 and |log2(fold change)| ≥ 0.58 were considered significantly regulated. Up- and downregulation is indicated by positive and negative values, respectively
