Fig. 3.

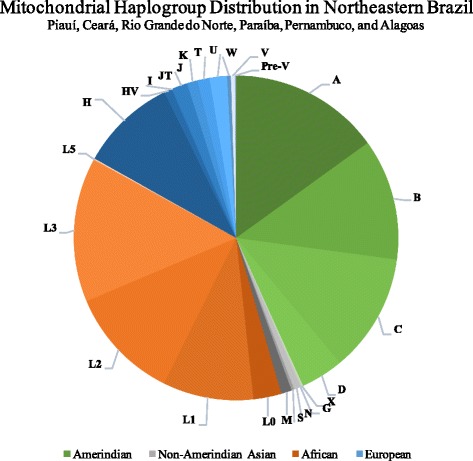
Distribution of mtDNA haplogroups in Northeastern Brazil. Amerindian haplogroups in shades of green; Non-Amerindian Asian haplogroups in shades of gray; African haplogroups in shades of orange; European haplogroups in shades of blue

Distribution of mtDNA haplogroups in Northeastern Brazil. Amerindian haplogroups in shades of green; Non-Amerindian Asian haplogroups in shades of gray; African haplogroups in shades of orange; European haplogroups in shades of blue