Fig. 1.

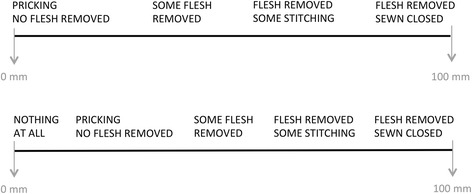
Schematic diagram over Visual Analogue Scale. Schematic diagram over Visual Analogue Scale 1 (VAS 1, upper) and VAS 2 (lower). Note: In the questionnaire only the ends of the VAS were written out and mm was not indicated

Schematic diagram over Visual Analogue Scale. Schematic diagram over Visual Analogue Scale 1 (VAS 1, upper) and VAS 2 (lower). Note: In the questionnaire only the ends of the VAS were written out and mm was not indicated