Fig. 3.

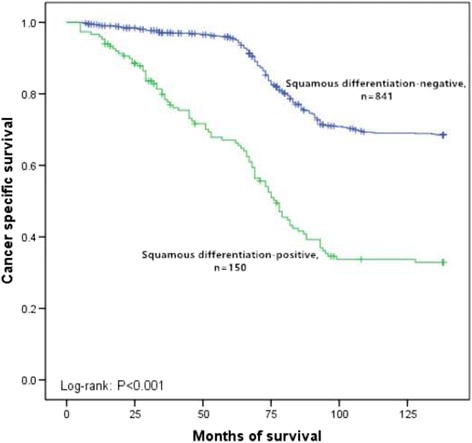
Kaplan–Meier curve of the cancer specific survival rates for the squamous differentiation-negative and squamous differentiation-positive in subgroup of high-grade (p < 0.001)

Kaplan–Meier curve of the cancer specific survival rates for the squamous differentiation-negative and squamous differentiation-positive in subgroup of high-grade (p < 0.001)