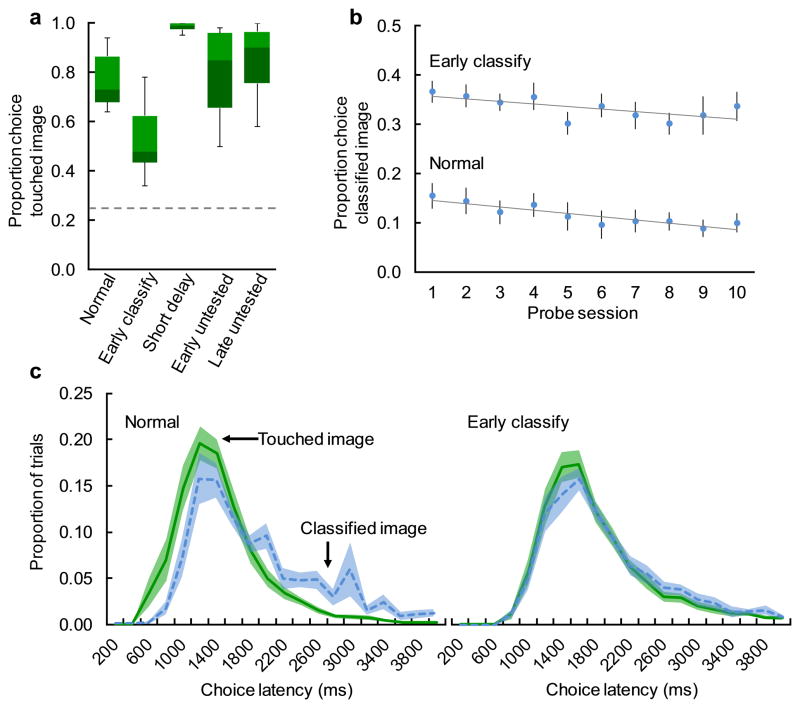
Fig. 3. Source memory errors were specific to early classify trials, were stable across sessions, and were as quick as correct choices.
a. Proportion choice of the touched image on normal trials, early classify trials, and control trials in the first probe session. Bars represent medians and quartiles, whiskers represent minimum and maximum values, and the dashed horizontal line represents chance. b. Mean proportion choice (±SEM) of the classified image on normal trials and early classify trials across ten consecutive probe sessions. c. Distributions of latency to choose the touched (solid green) or classified (dashed blue) image at test. Lines represent the proportion of each trial type (±SEM) that fell within each 200ms bin.

