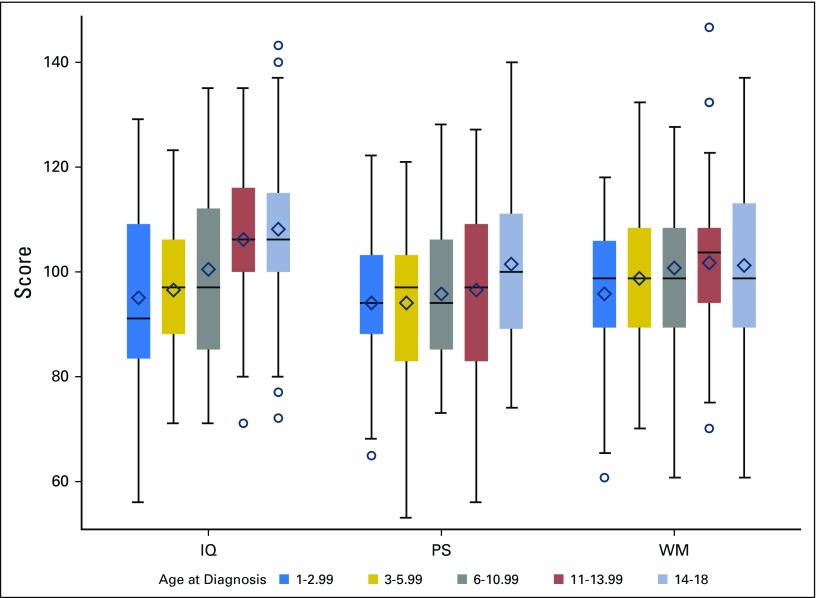
Fig A1.
Cognitive outcomes by age at diagnosis. Colored boxes represent the middle 50% of the sample with the median represented as a horizontal line and the mean as a diamond. The ends of the whiskers are the minimum and maximum values discounting outliers that are beyond the 1.5 interquartile ranges above or below the 75th and 25th percentiles, respectively, which are delineated separately as circles. For presentation purposes, WM was scaled to have a sample mean of 100 and a sample SD = 15. IQ, intelligence quotient; PS, processing speed; SD, standard deviation; WM, working memory.

