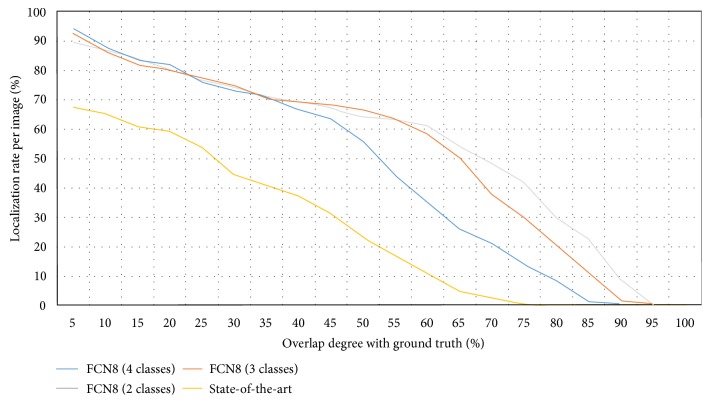
Figure 4.
Localization rate of polyps as a function of IoU. The x-axis represents the degree of overlap between ground truth and model prediction. The y-axis represents the percentage of correctly localized polyps. Different color plots represent different models: FCN8 with 4 classes, FCN8 with 3 classes, and FCN8 with 2 classes and previously published method [13] (referred to as state-of-the-art in the plot).

