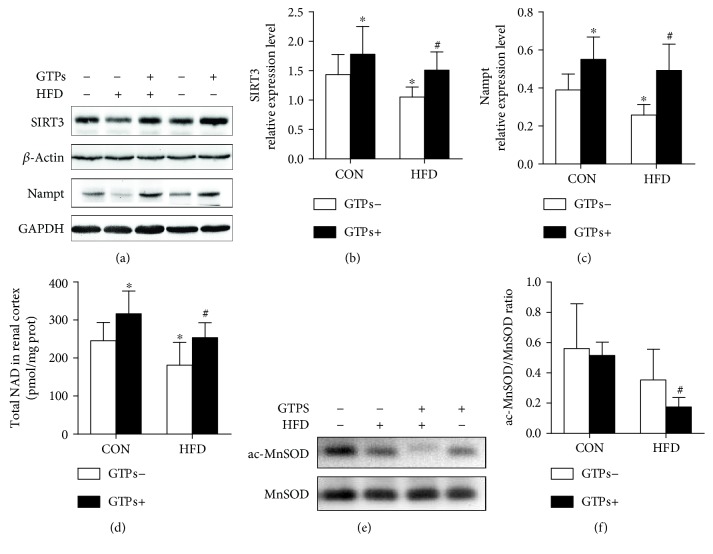
Figure 6.
Effects of GTPs and HFD on SIRT3 expression and activity. (a, b, c) Western blot bands and relative expression levels of renal SIRT3 and Nampt. (e, f) Western blot analysis of acetylated MnSOD and total MnSOD and the ratio of acetylated MnSOD/MnSOD. The data are represented as the mean ± SD (n = 6–8); ∗P < 0.05 versus the control group and #P < 0.05 versus the HFD group.

