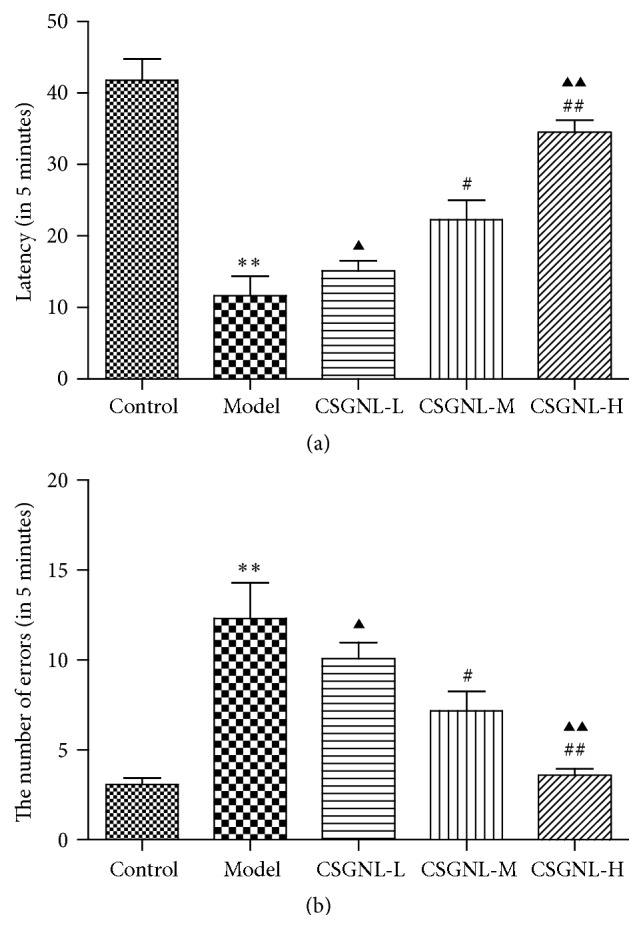
Figure 6.

Effects of optimal CSGNL on the learning and memory of mice in step-through test. (a) The latency. (b) The number of errors. The data are expressed as the mean ± SEM (n = 15). ∗∗p < 0.01 versus the control group; #p < 0.05 and ##p < 0.01 versus the model group; ▲p < 0.05 and ▲▲p < 0.01 versus the CSGNL-M group.
