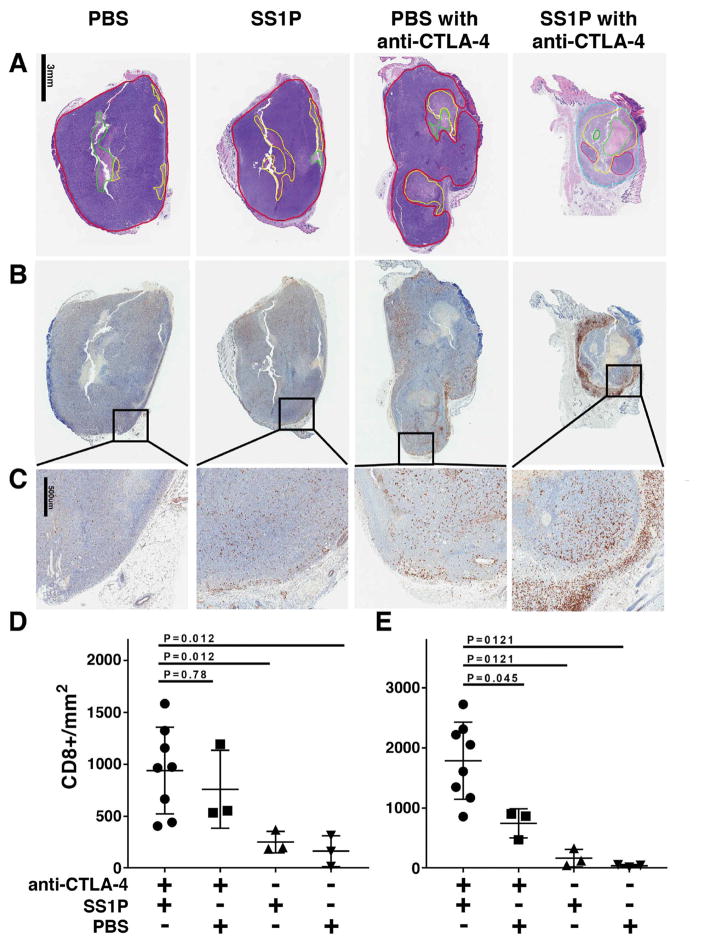
Figure 5. Analysis of tumors treated with PBS, SS1P, PBS and anti-CTLA-4 or SS1P and anti-CTLA-4.
(A) Sections of tumors stained with H and E. Areas outlined in green are necrotic, areas out-lined in yellow show micro-abscesses, and areas with viable tumor cells are outlined in red. The area outlined in blue in the tumor treated with SS1P and anti-CTLA-4 is a collar containing inflammatory cells. (B) Sections of tumors stained with anti-CD8 at low magnification (1X). (C) Sections of tumors stained with anti-CD8 at high magnification (5X). Tumors from the PBS, SS1P and PBS with anti-CTLA-4 groups were harvested when the tumors reached about 300 mm3 in size. Tumors from the combination treated group were harvested when the tumor volume was reduced by 20–60% from the maximum (8 mice). (D) Number of CD8+ T cells present in the tumor mass. (E) Number of CD8+ T cells in the collar surrounding the tumor.

