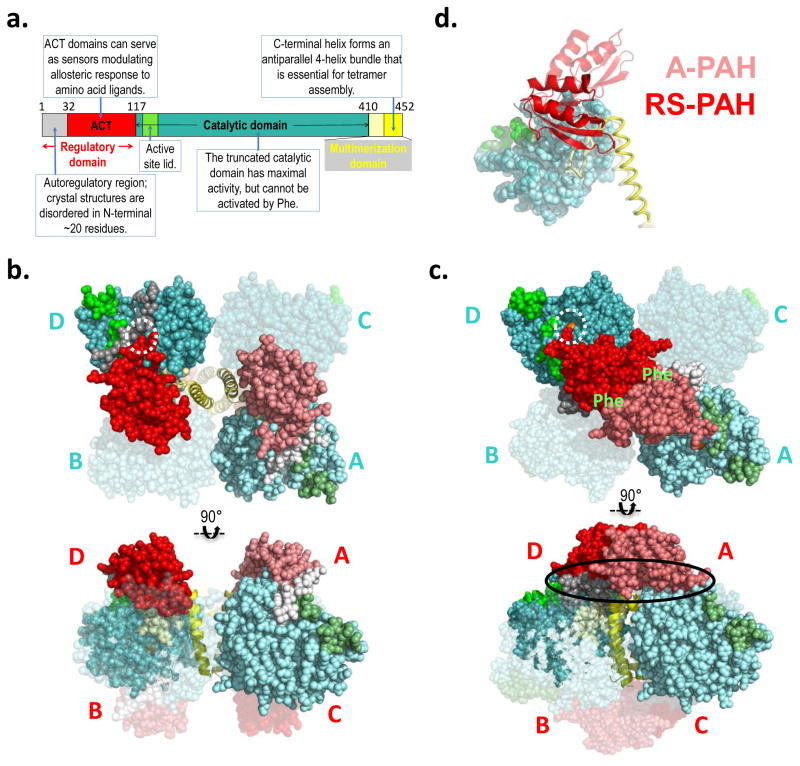
Figure 2. PAH structure and model.
a) The annotated domain structure of PAH illustrates the regulatory, catalytic, and multimerization domains, including subdomains. Numbered residues correspond to the termini and hinges. Coloring is reflected in the darker subunits of the molecular illustrations. b) The first crystal structure for full length PAH (PDB id 5DEN, 2.9 Å resolution (18)) is illustrated using orthogonal views (top and bottom), and represents RS-PAH. The bulk of the protein is shown in balls, while the C-terminal helix is in cartoon. Two of the four subunits are transparent. One opaque subunit is illustrated using lighter shades of the colors in part a. The subunits are labeled in cyan near the catalytic domains (top); they are labeled in red near the regulatory domain (bottom). The dotted white circle illustrates the autoregulatory region partially occluding the enzyme active site (the active site iron is obscured by the auto-inhibitory interaction). Blocked active-site access (partial or total) results in low activity. c) A composite homology model of the A-PAH tetramer (18), depicted as in part b. A-PAH is active because the active sites are accessible (white circle in top image, active site iron is visible). A-PAH contains a close association between the ACT domains of subunits located along the diagonal of the tetramer. Formation of this subunit-subunit interface was predicted in 2013 (16) along with the resultant two allosteric Phe binding sites (location indicated by green “Phe” label on top image). The oval in the bottom image shows the proposed multimer-specific interfaces that might form the binding site for a new pharmacological chaperones that could potentiate, rather than interfere with, allosteric Phe binding. d) An overlay of one subunit of the RS-PAH structure (darker shades) with one subunit of the A-PAH model (lighter shades) illustrates the relocation of the regulatory domain relative to the rest of the subunit. The regulatory domain is in cartoon, the catalytic domain is in balls, and the multimerization domain is in coil representation. Regulatory domain relocation results from a ~90° rotation relative to the catalytic domain; displacement of the regulatory domain in this way disallows active site occlusion by the autoregulatory region.

