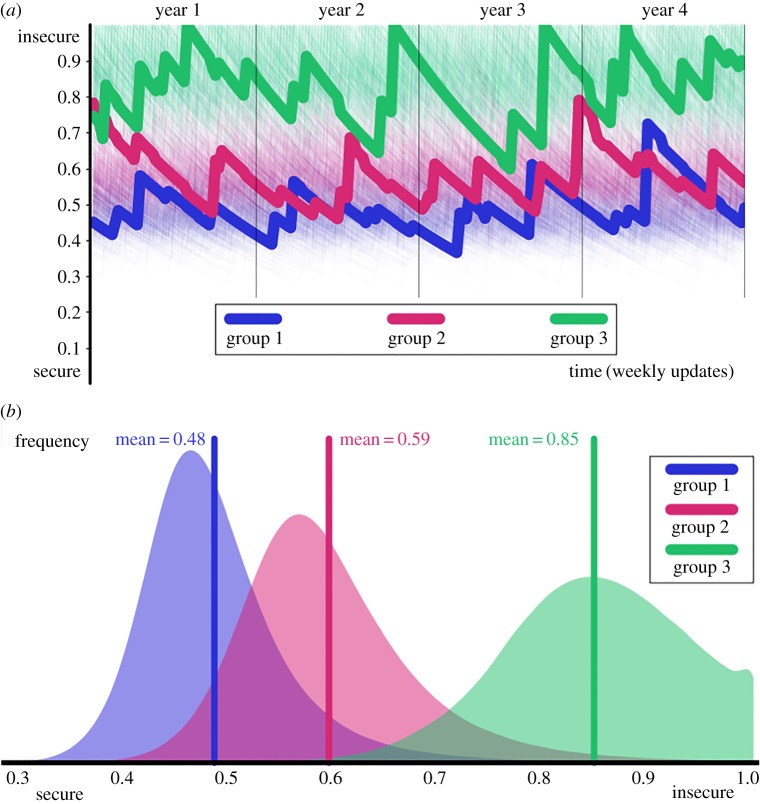
Figure 3.
Simulated perception of security with μ=0.1, ν=0.9, ψ=0.5, preferred interactions (homophily ) and crime rates . (a) 500 individuals from each group and three representative members highlighted. The highlighted individual from group 3 suffered four crimes (when sk=1); the other jumps are due to the social interactions; the slow decay is the memory loss. (b) The distribution of the perception of security for all individuals observed during the 4 years.

