Figure 1.
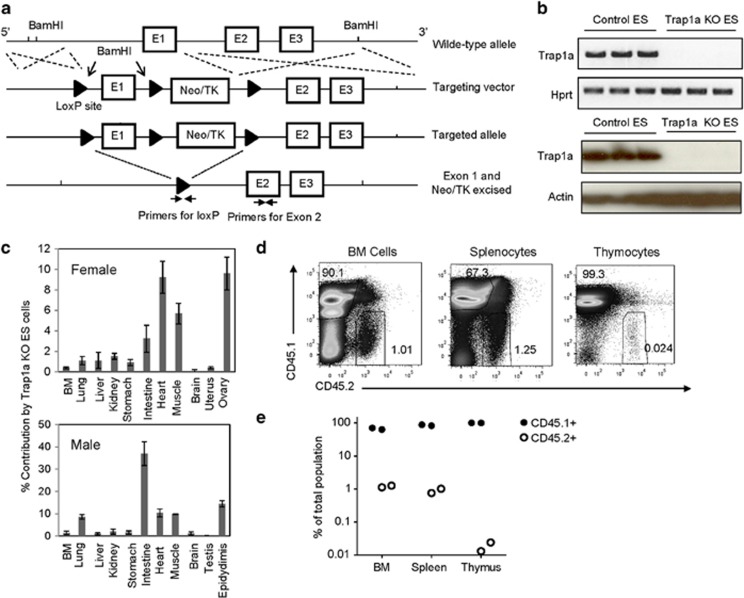
Contribution of Trap1a−/y ES cells to mouse tissues through blastocyst chimera analysis. (a) Diagram of constructs and mutant alleles. (b) Confirmation of Trap1a inactivation in ES cell clones by RT-PCR and western blot analysis. The Trap1afl/y ES cells were electroporated with a vector expressing Cre recombinase. Three clones in control and Cre-transduced groups were compared for RNA and protein expression. (c) Contribution of Trap1a−/y ES cells to various tissues and organs. Chimera mice with greater than 50% contribution based on coat color were analyzed for contribution of Trap1a−/y cells based on quantitative PCR. (d) Flow cytometric quantitation of Trap1a−/y (CD45.2+) hematopoietic cells in the BM, spleen and thymus. Data from the female chimera mouse are presented; similar results were obtained in the male chimera. (e) % Contribution of CD45.2+ cells in the male and female chimera mice. BM, bone marrow; ES cells, embryonic stem cells; RT-PCR, reverse transcriptase-polymerase chain reaction.

