Figure 5.
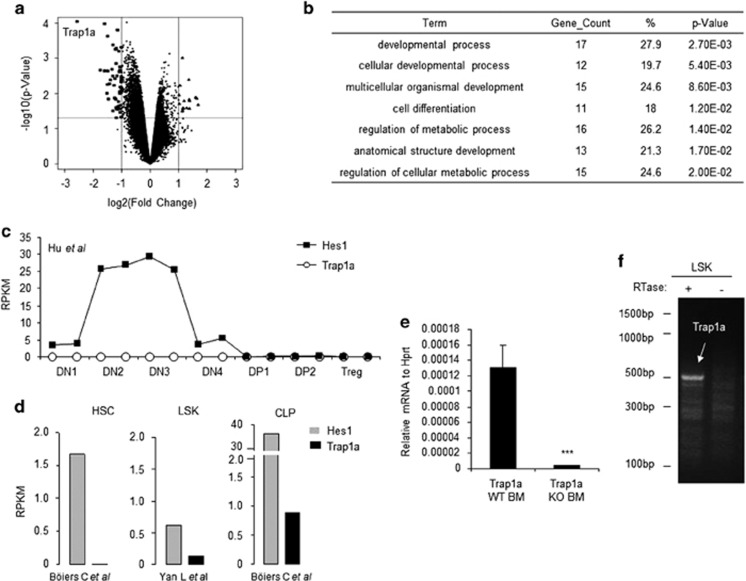
Function of Trap1a gene based on global expression analysis. (a) Identification of genes that are affected by Trap1a deletion in ES cells. The X-axis shows the ratios of expression levels between WT and Trap1a−/y ES cells, while the Y-axis shows –log10 P values. The large symbols indicate genes that are either upregulated (triangles) or downregulated (squares) by Trap1a deletion. (b) Functional enrichment analysis suggests that Trap1a may be involved in cellular development and metabolic pathways. (c–e) Trap1a is expressed in LSK and CLP but not in thymocytes and hematopoietic stem cells. (c, d) In silico analyses of RNAseq data from previous publications. (e) qPCR analysis of bone, marrow cells sorted from bone marrow chimera mice. (f) RT-PCR verification of Trap1a expression in the sorted LSK from CD45.1 (WT) and CD45.2 (mutant) LSK. CLP, common lymphoid progenitor; LSK, Lin−/SCA+/Kit+; qPCR, quantitative polymerase chain reaction; RT-PCR, reverse transcriptase-polymerase chain reaction.

