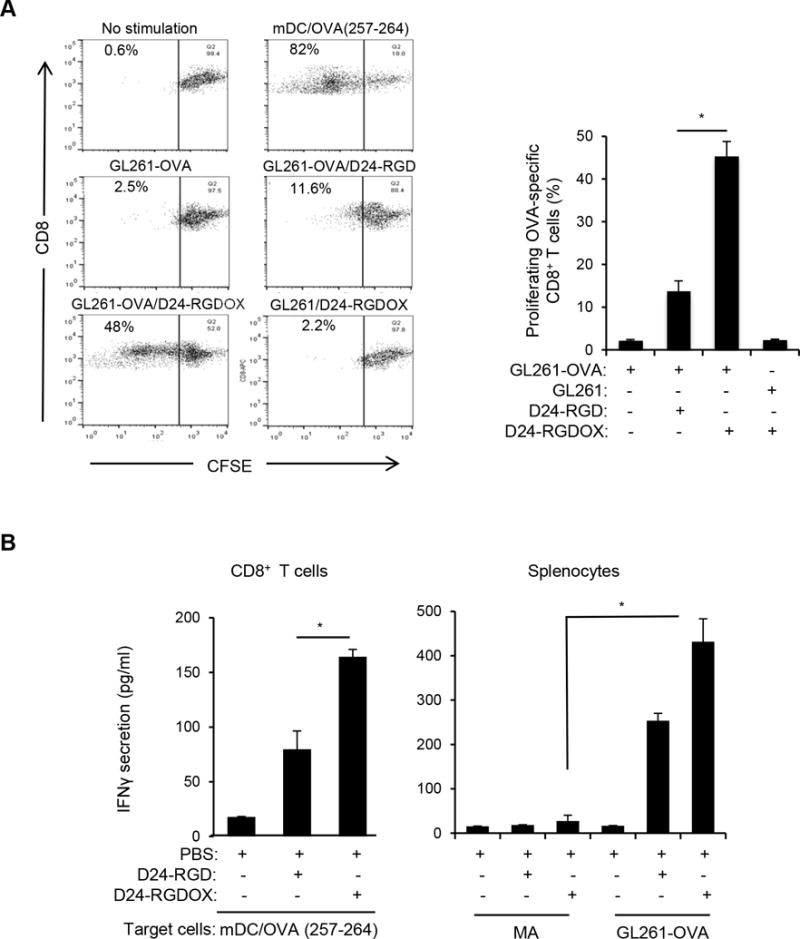
Figure 4.

Tumor-specific immunity mediated by Delta-24-RGDOX. A, In vitro proliferation of T-cells recognizing tumor-associated antigen induced by Delta-24-RGDOX. OVA-specific CD8+ T-cells (from the spleens of OT-I mice) pre-stained with CFSE were incubated with the indicated pre-fixed target cells. After 4 days, the cells were analyzed using flow cytometry for CFSE amount to measure cell proliferation. (left panel), Cells were gated for CD8+, and representative dot plots are shown. The numbers at the upper left corners indicate the percentage of proliferating T-cells. Unstimulated T-cells (no stimulation) were used as a negative control, and T cells stimulated with pre-fixed mouse dendritic cells (mDCs) primed with OVA (257-264) peptide (mDC/OVA(257-264)) were used as a positive control. (right panel), Quantification of the proliferating T-cells. Shown are the percentages of the proliferating CD8+ cells after stimulation with the indicated pre-fixed target cells: GL261-OVA cells with or without infection of Delta-24-RGD or Delta-24-RGDOX, GL261 cells infected with Delta-24-RGDOX. B, Tumor-specific immunity induced by Delta-24-RGDOX. (left panel), CD8+ T-cells from the spleens of GL261-OVA glioma-bearing mice treated intratumorally with PBS, Delta-24-RGD or Delta-24-RGDOX (5 mice per group) as in Figure 3A were isolated and stimulated with pre-fixed mDCs primed with OVA (257-264) peptide for 40 hours. (right panel), splenocytes from the above treatment groups were stimulated with pre-fixed mouse primary astrocytes (MAs) or GL261-OVA cells for 40 hours. The concentration of IFNγ in the supernatant was assessed with ELISA. Values represent the mean ± standard deviation (n = 3). * P ≤ 0.001, 2-tailed Student’s t test. D24-RGD: Delta-24-RGD; D24-RGDOX: Delta-24-RGDOX.
