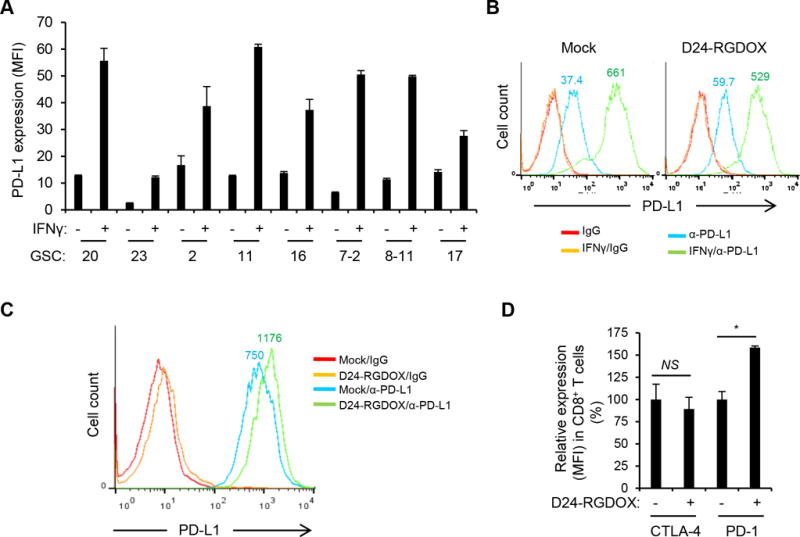
Figure 6.

PD-L1/PD-1 expression in glioma or T cells. A, PD-L1 expression in human glioblastoma stem cells (GSCs with serial numbers). Cells were cultured with or without human IFNγ (200 U/ml) for 48 hours and then analyzed with flow cytometry for PD-L1 expression measured by median fluorescence intensity (MFI). Values represent the mean ± standard deviation (n = 3). B, PD-L1 expression in mouse glioma GL261-5 cells. Cells were mock-infected or infected with Delta-24-RGDOX (D24-RGDOX, 100 PFU/cell) in the presence or absence of mouse IFNγ (100 U/ml) for 48 hours and then analyzed with flow cytometry for PD-L1 expression. C, PD-L1 expression in glioma cells from implanted tumors. Fourteen days after the implantation of GL261 cells expressing enhanced green-fluorescent protein (EGFP), Delta-24-RGDOX (D24-RGDOX) was injected intratumorally. After 24 hours, the tumors (taken from 3 mice/group) were harvested, dissociated, and analyzed with flow cytometry for PD-L1 expression. Tumor cells were gated for EGFP+. IgG staining was used as a negative control. The colored numbers indicate the MFI for the curve of the same color in B and C. D, Effect of Delta-24-RGDOX on CTLA-4 and PD-1 expression in CD8+ T cells. Expression of CTLA-4 or PD-1 on the T cells from BILs in glioma-bearing mice treated with PBS or Delta-24-RGDOX as shown in Figure 3A was assessed with flow cytometry. The relative expression levels are shown. The values from the mock-treated (PBS) group were set to 100%. Values represent the mean ± standard deviation (n =3). NS: not significant (P ≥ 0.05); * P = 0.0007, 2-tailed Student’s t test.
