Fig. 1.
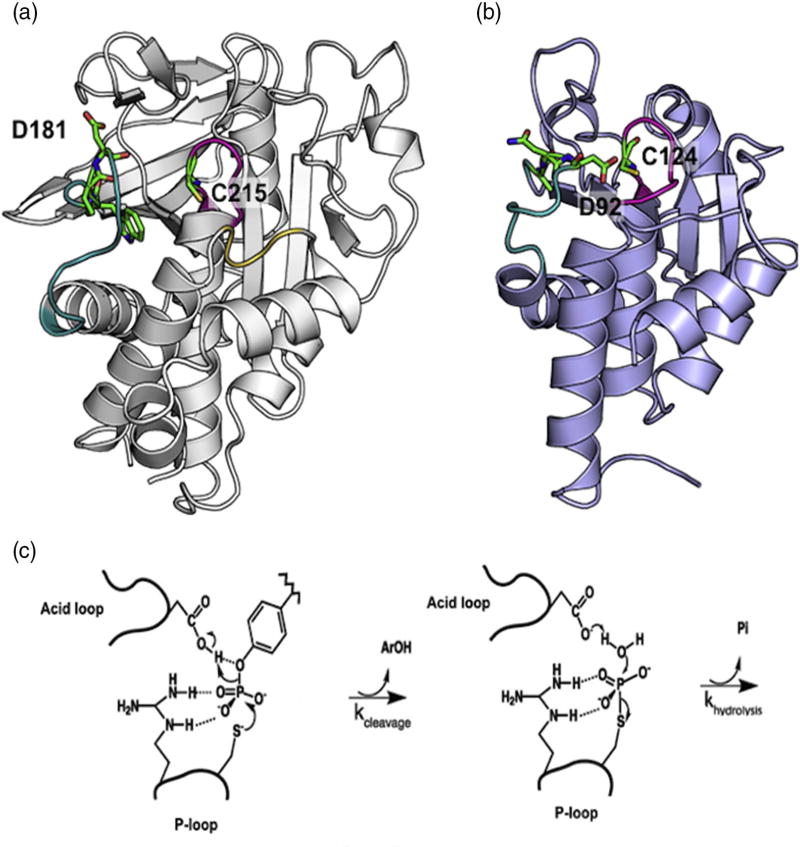
PTP structure and mechanism. (a) Apo WT PTP1B (PDB ID: 2HNP) is represented in gray ribbon [50]. The acid loop is shown in teal, P-loop in magenta, and the Q-loop in yellow. W179, P180, D181, and C215 are shown in stick configuration. (b) Apo WT VHR (PDB ID: 1VHR) is represented in blue ribbon [51]. The acid loop is shown in teal and the P-loop is in magenta. A90, N91, D92, and C124 are shown in stick configuration. (c) The catalytic reaction occurs in two steps. First, a cysteine from the P-loop acts as a nucleophile to attack the phosphorus atom of the phosphorylated tyrosine of the substrate. The P–O bond is cleaved and the acid loop closes to facilitate the protonation of the leaving aryl group by aspartic acid. In the second step, the aspartate residue aids in the hydrolysis of the covalent intermediate with concomitant release of inorganic phosphate.

