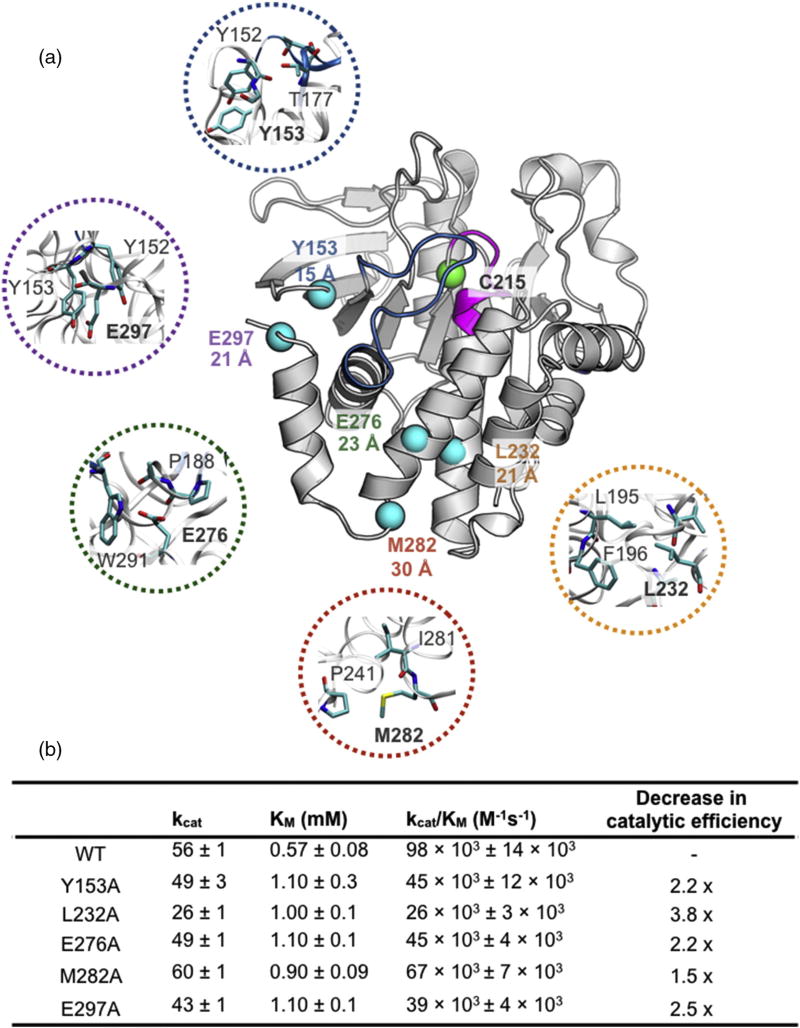
Fig. 3.
Allosteric sites selected for mutagenesis in PTP1B. (a) Locations of allosteric residues selected for mutations to alanine are shown as spheres. The catalytic nucleophile C215 is shown as a green sphere. The distance between the Cα atom of C215 and the Cα of the indicated residue is displayed underneath the residue label. Closeup view of the allosteric residues selected for mutation is color-coded with respect to each mutant. (PDB ID: 1PTT) [26]. Table of Michaelis–Menten kinetic constants of allosteric alanine mutants is shown below. Thermal stability of each mutation is shown in SI Fig. 5.

