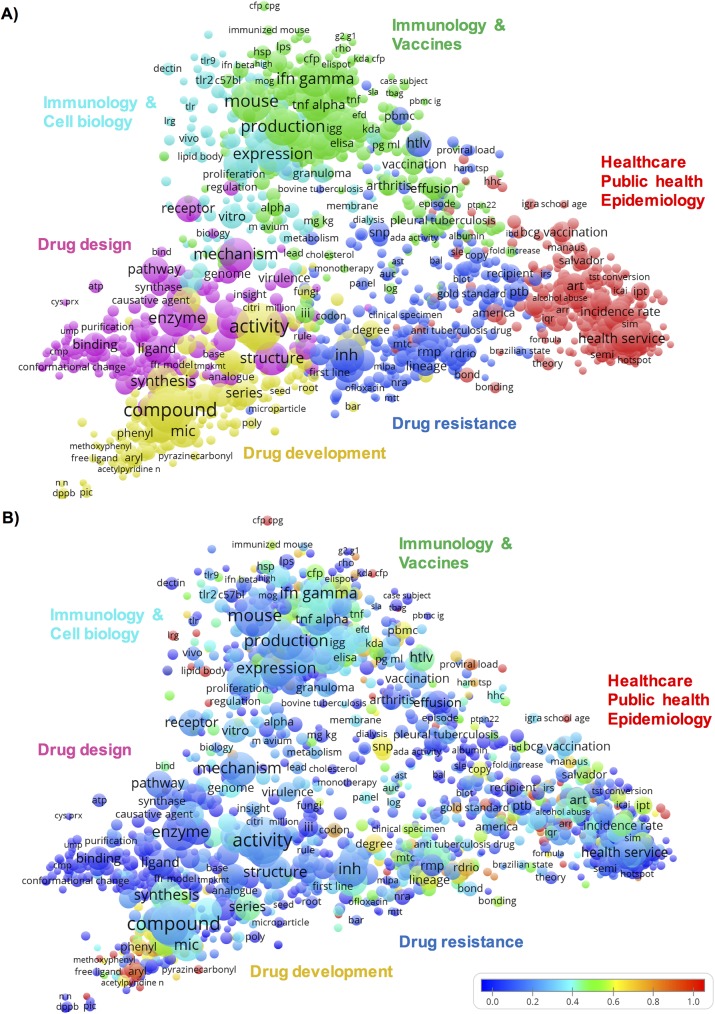
Fig 2. Term map of Brazilian TB research.
The map shows 1,651 terms extracted from titles and abstracts of TB publications involving Brazilian institutions. The closer two terms are located to each other, the stronger their relation. Each term is represented by a circle and its diameter and label size indicate the number of publications that have the corresponding term in their title or abstract. Each term occurs in at least five publications. A) Colors indicate clusters of terms that have co-occurred more frequently in the dataset. B) Colors indicate the occurrence of a term in publications involving Fiocruz relative to Brazil’s average, where blue represents a low occurrence, green average, and red a high occurrence.

