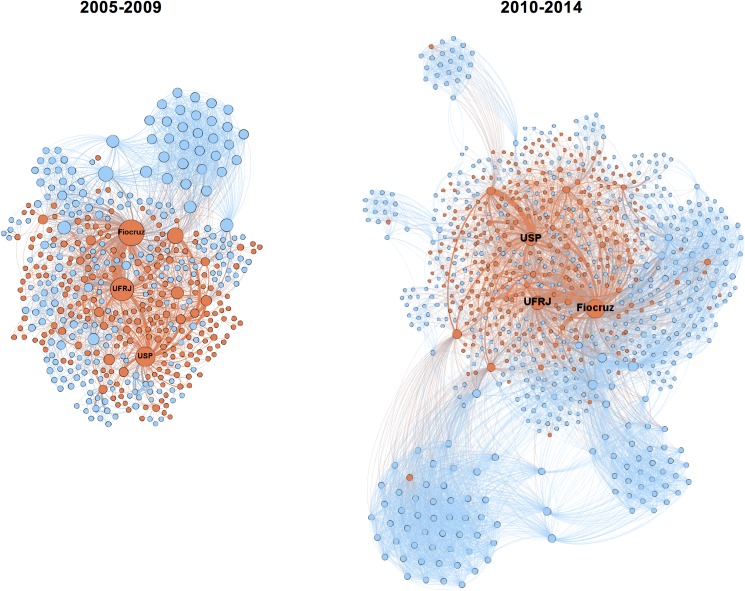
Fig 3. Evolution of TB research networks involving Brazilian institutions (2005–2009 and 2010–2014).
Each node represents one institution and two institutions were considered connected if their members shared the authorship of a paper. Nodes are color coded—red for Brazil and blue for foreign organizations. The size of the nodes is proportionate to their degree centrality. For visualization purposes only the giant component is shown. The top three Brazilian organizations with highest degree centrality are labeled.

