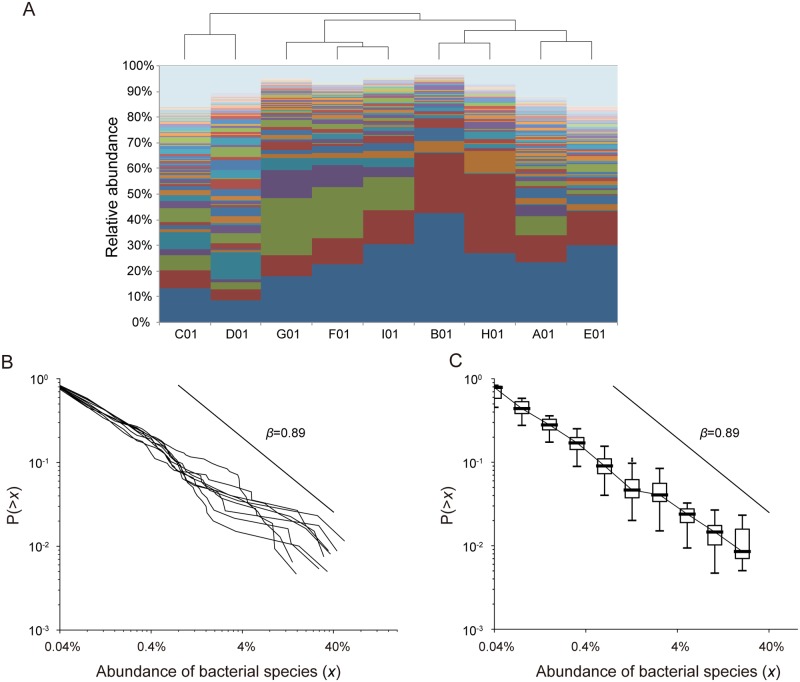
Fig 2. CRADs of murine gut microbiomes.
A: Clustering of the bacterial composition at the OTU level in mice. Hierarchal clustering is performed at the OTU-level abundance of the samples. Each OTU is shown in a different color. B: Individual CRADs of murine gut microbiomes based on the OTU-level composition. C: Median CRADs of the same samples as those in (B).

