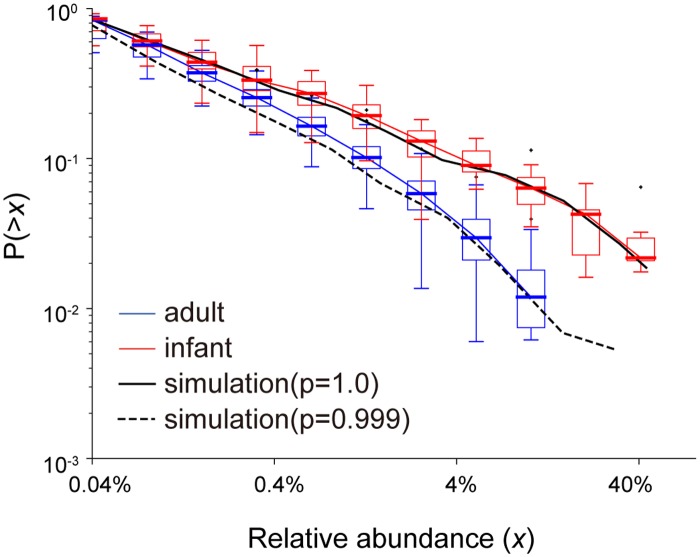
Fig 6. Simulation of CRADs of infant and adult gut microbiomes.
Red and blue boxes represent the CRADs of the gut microbiomes of the 13 infants and the 104 Japanese adults, respectively. The solid line and the dashed line represent the simulation results for p = 1.0 with 100 initial species and p = 0.999 with 200 initial species, respectively. Lattice size in the following simulations was (x, y, z) = (40, 40, 2000). The simulation results are obtained from the average of 100 repetitions.

