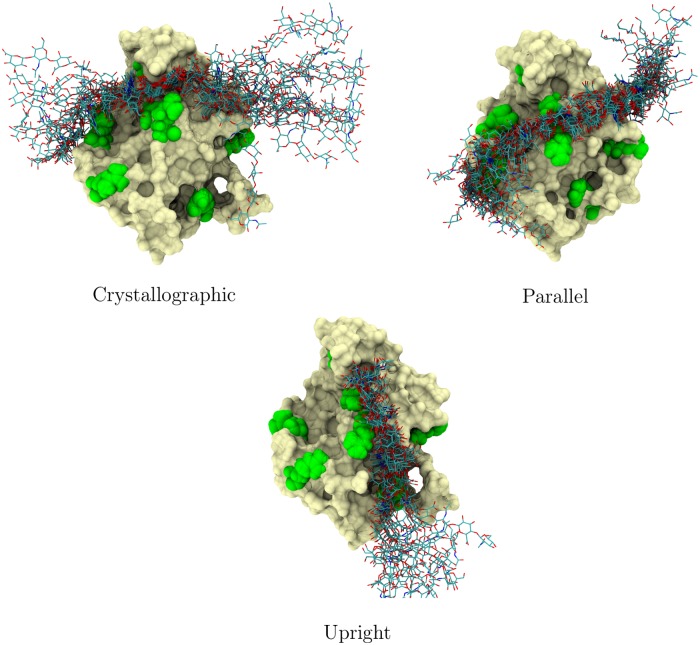
Fig 4. Stability of each binding mode.
Fluctuations observed in the HA structure for each binding mode. The tan surface represents the protein in the first frame of the trajectory. The green spheres are the arginine residues. The multicolored sticks represent the HA conformation, plotted here every 50 nanoseconds of the trajectory. The frames have been taken from the first replica system of each Gathering simulation (Table A in S1 File) (data based on the other replicas were consistent with the data shown here).

