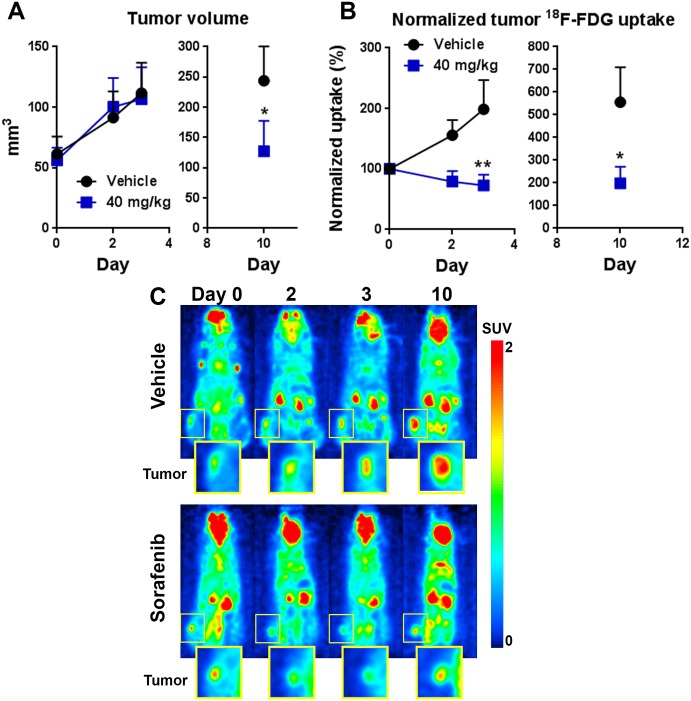
Fig 4. Using 18F-FDG PET to visualize early treatment responsiveness.
A: Tumor volume data of mice receiving vehicle or daily sorafenib treatment at 40 mg/kg. The treatment was initiated on day 0, with mice enrolled into the study with tumor volumes ~ 50–75 mm3. B: Relative tumor 18F-FDG uptake levels using the day 0 data as 100%. Each animal was injected IV with 100 μCi of 18F-FDG and were acquired using the G8 PET/CT system after 1 h incubation period for tracer uptake (n = 5 per group; *p < 0.01,**p < 0.001; two-way ANOVA, mean and s.e.m., representative of two experiments). C: Representative microPET images of animals treated with vehicle or 40 mg/kg of sorafenib (unit: SUVtotal).

