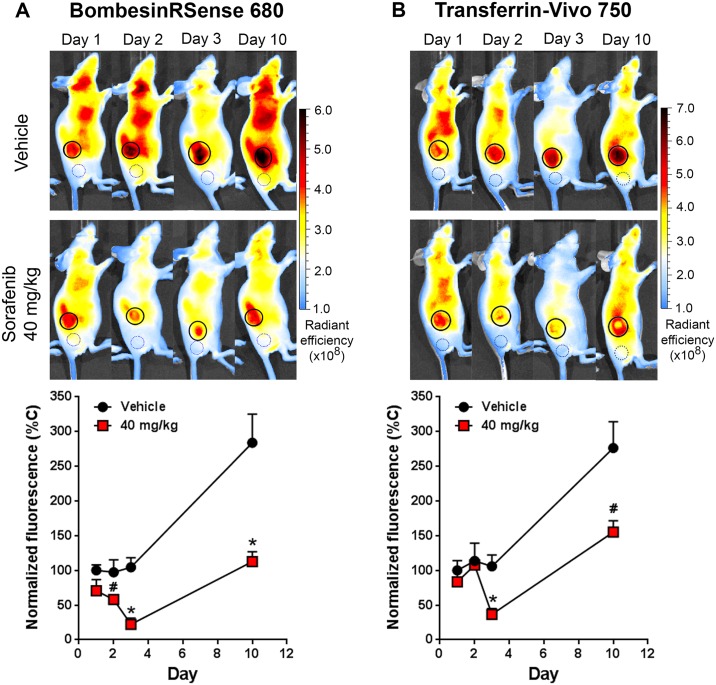
Fig 7. Monitoring subtle tumor metabolic changes in response to low dose sorafenib.
Metabolic changes in HCT116-luc2 tumors from the study represented in Fig 6 were visualized using BRS-680 and TfV-750. The probes were injected IV the day before FLI imaging on the IVIS Spectrum CT imaging system. A: Representative mouse images are shown for 2D FLI of BRS-680 tumor uptake, with quantitation of tumor fluorescent signal graphed below. Tumor regions of interest (ROI) are represented by solid line circles, and background control ROI are represented by dotted line circles. Average background signal was determined for each probe, normalized for ROI size, and subtracted from each tumor FLI value to more accurately determine levels of inhibition. B: Representative mice are shown for TfV-750 uptake in tumors, with quantitation of tumor fluorescent signal graphed below. Results are representative of three independent studies and are shown as mean and s.e.m. (#p < 0.05, *p < 0.01, day 1–2: n = 10, day 3–10: n = 5, Student’s t-test).

