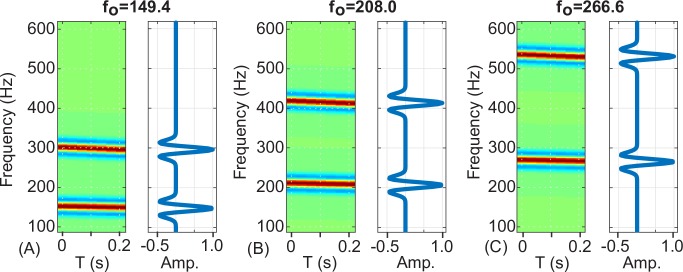
Fig 2. Example kernel spectrograms and frequency-amplitude profiles.
Example spectrograms (left panels) and frequency-amplitude profiles (right panels) for three of the 51 kernels used. A) Kernel #5, f0 = 149.4 Hz; B) Kernel #25, f0 = 208.0 Hz; C) Kernel #45, f0 = 266.6 Hz. The detection process works by pattern matching (i.e. cross-correlating in the time dimension) the individual kernels against the data spectrogram.

