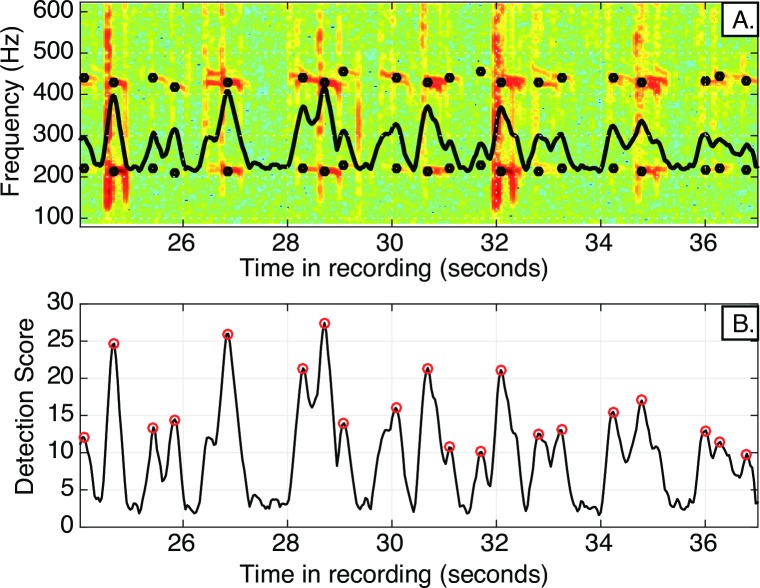
Fig 3. Example spectrogram and detector output.
A). Spectrogram of a portion of a recording taken in Harris Creek in May 2015 shows detected toadfish boatwhistles. The black circles indicate the first and second harmonic detection frequencies. B) The detection score plot shows the associated detection score for each boatwhistle, with circles denoting the detection. The detection score represents the highest correlation value, returned from the suite of kernels, at each time step. The threshold for declaring a detection is determined empirically (See Methods: Detector sensitivity analysis).

