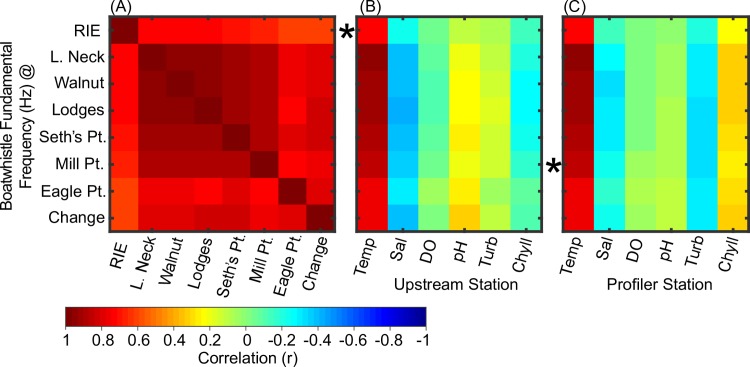
Fig 7. Correlation matrix for fundamental frequency and environmental variables.
Correlations of boatwhistle call frequency (median value determined per recording) between hydrophone sites (A) and with regard to environmental time series recorded upstream of Rabbit Island East (B) and at the profiler station near Mill Point (C). Each row represents a hydrophone site (ordered by latitude, see Fig 1). The closest hydrophone site to each water quality monitoring station is marked with a star.

