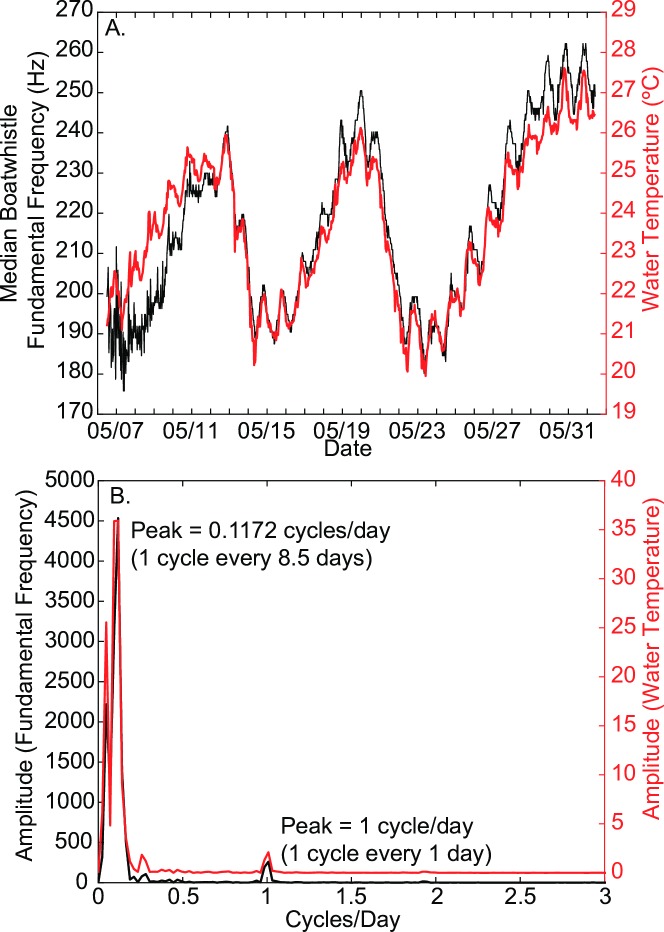
Fig 8. Periodicity of fundamental frequency and water temperature.
A) Fundamental frequency of toadfish boatwhistles (black) and water temperature (red) versus time. Fundamental frequency is averaged within each recording window (30-minute intervals) across all 8 sites, and water temperatures are taken from the upstream monitoring station. B) Spectrum of the boatwhistle fundamental frequency and the water temperature time series. These datasets vary in phase with one another at periods of 1.0 and 8.5 days.

