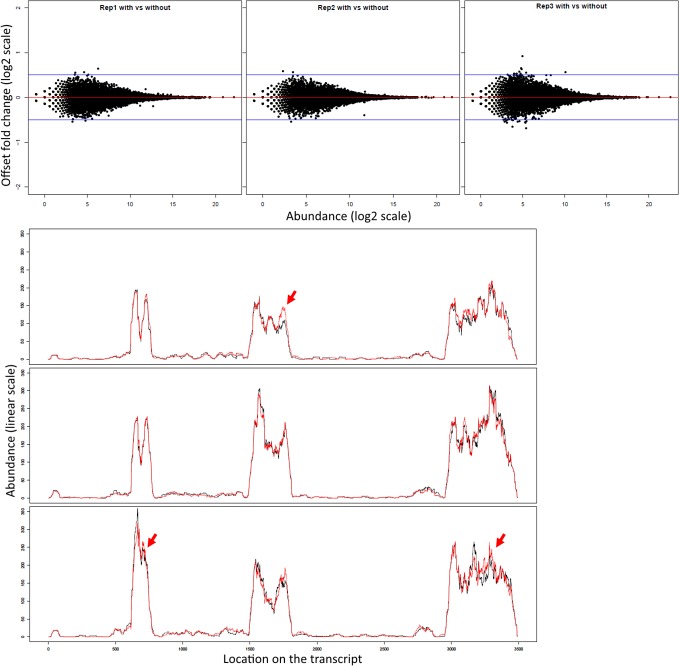
Fig 2. Comparison of results obtained using the subsampling with or without replacement normalization.
In the top panel we present the MA plots on the gene expression levels, normalized using either the with- or without- replacement approaches, for the three replicates of the 02+H sample (02h, rivals, HT body part). Although the variability between the two approaches was contained within the +/- 0.5 log2(OFC) boundary, we observed a higher variability in expression for the low abundance genes. The bottom panel shows the presence plots for the gene FBgn0033865 for each of the three replicates (on individual panels) obtained using either the subsampling without replacement (black solid line) or subsampling with replacement (red solid line). The arrows indicate the regions where the two approaches provided different answers. The arrow indicating the first exon of the gene highlighted the difference observed for the third replicate (02+H, rep3).

