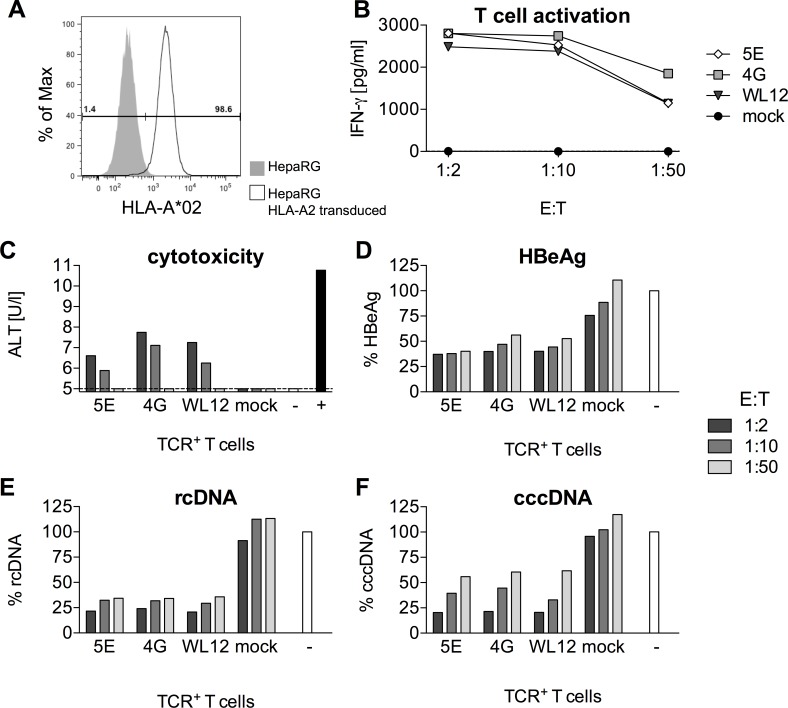
Fig 7. Recognition of HBV-infected cells by TCR-transduced T cells.
(A) Expression of HLA-A*02 on HepaRG target cells determined by flow cytometry. (B-D) HBV-infected HepaRG cells were co-cultured with decreasing numbers of TCR-transduced T cells for 44 hours. One TCR per peptide specificity was selected (5E: C18-specific, 4G: S20-specific, WL12: S172-specific). Mock = untransduced PBMC,— = medium control without PBMC. (B) T-cell activation measured by release of IFN-γ into the supernatant. (C) Alanine transaminase (ALT) released from dying hepatocytes. Supernatants from triplicate co-cultures per TCR were pooled for this analysis. + = Triton-X, positive control for cell lysis. (D) HBeAg in the supernatant was measured using a diagnostic ELISA. (E) Intracellular viral rcDNA and (F) nuclear cccDNA on day two were determined using qPCR. Values were normalized to the untreated medium control. Data are presented as mean values +/- SEM from triplicates.

