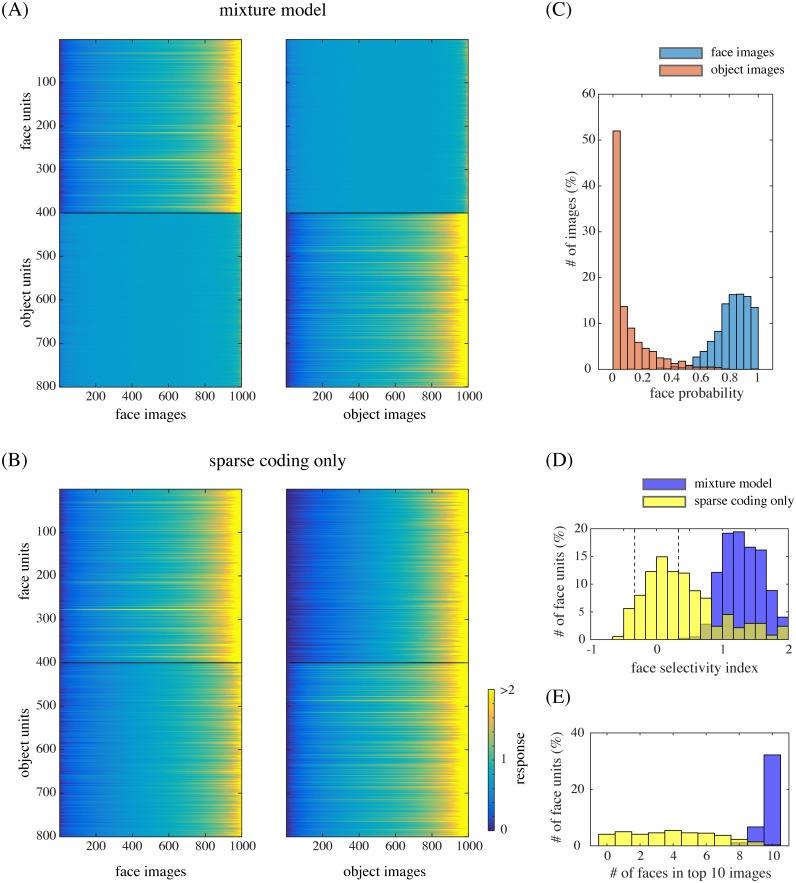
Fig 4.
(A) The responses of model face units (1–400) and model object units (401–800) to face images (left) and object images (right). The images are sorted by response magnitudes (color bar) for each unit. (B) The responses in the case of removing mixture computation. (C) The distribution of face posterior probabilities for face image inputs and for object image inputs. (D) The distribution of face-selectivity indices for the face units in the case of the mixture model (blue) or the case of the sparse coding model (yellow). The broken lines indicate the values −1/3 and 1/3. (E) The distribution of the number of face images in the top 10 (face or object) images that elicited the largest responses of each face unit.

